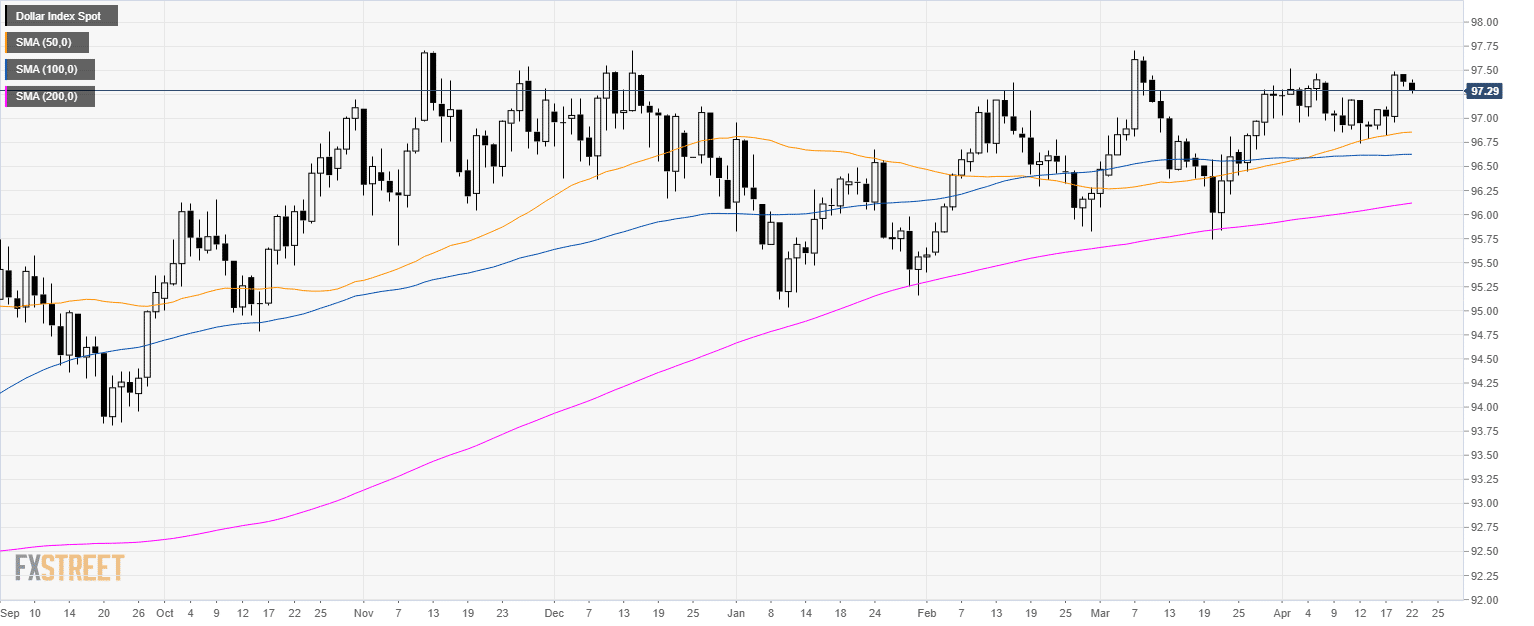
DXY daily chart
- The US Dollar Index (DXY) is trading in a bull trend above its 200-day simple moving average (SMA).
- After creating an inside day on Good Friday, DXY has weakened a little bit more on Easter Monday.
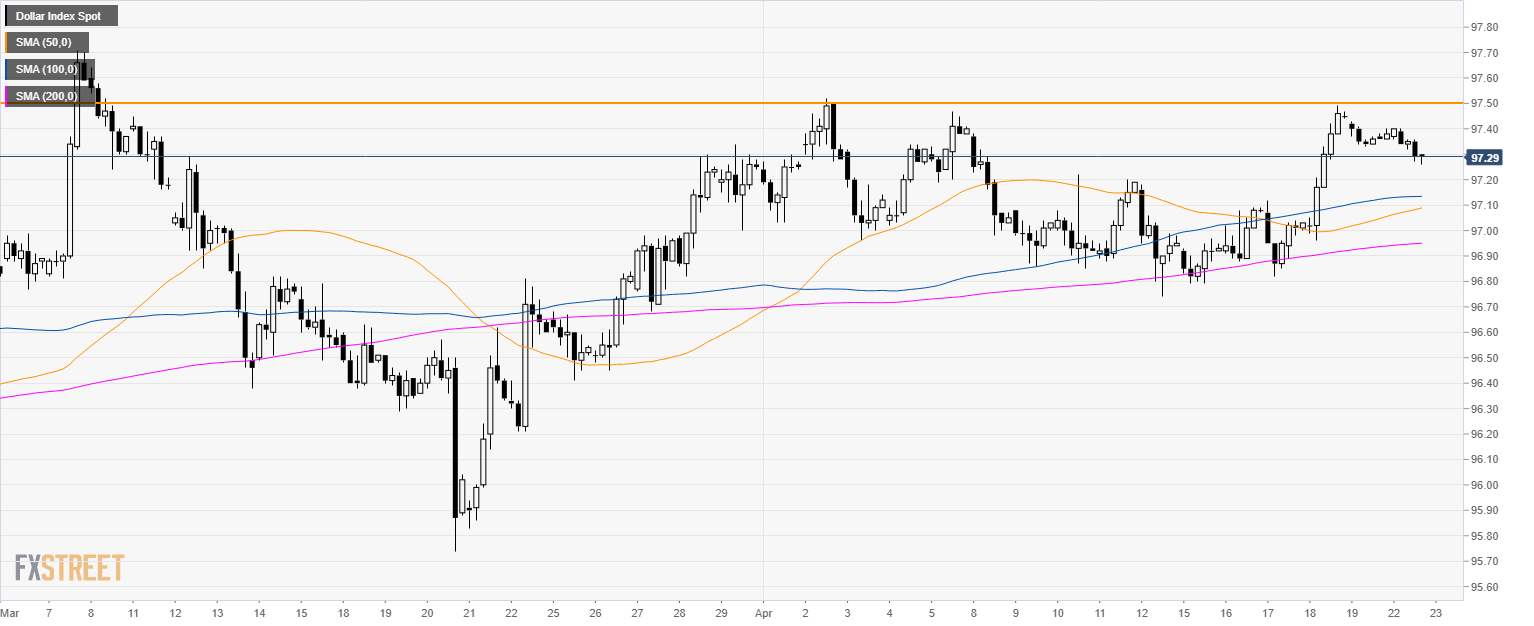
DXY 4-hour chart
- DXY is trading above its main SMAs suggesting bullish momentum in the medium-term.
- 97.50 is the highest price in April and that is the level to beat if bulls want to extend the uptrend.
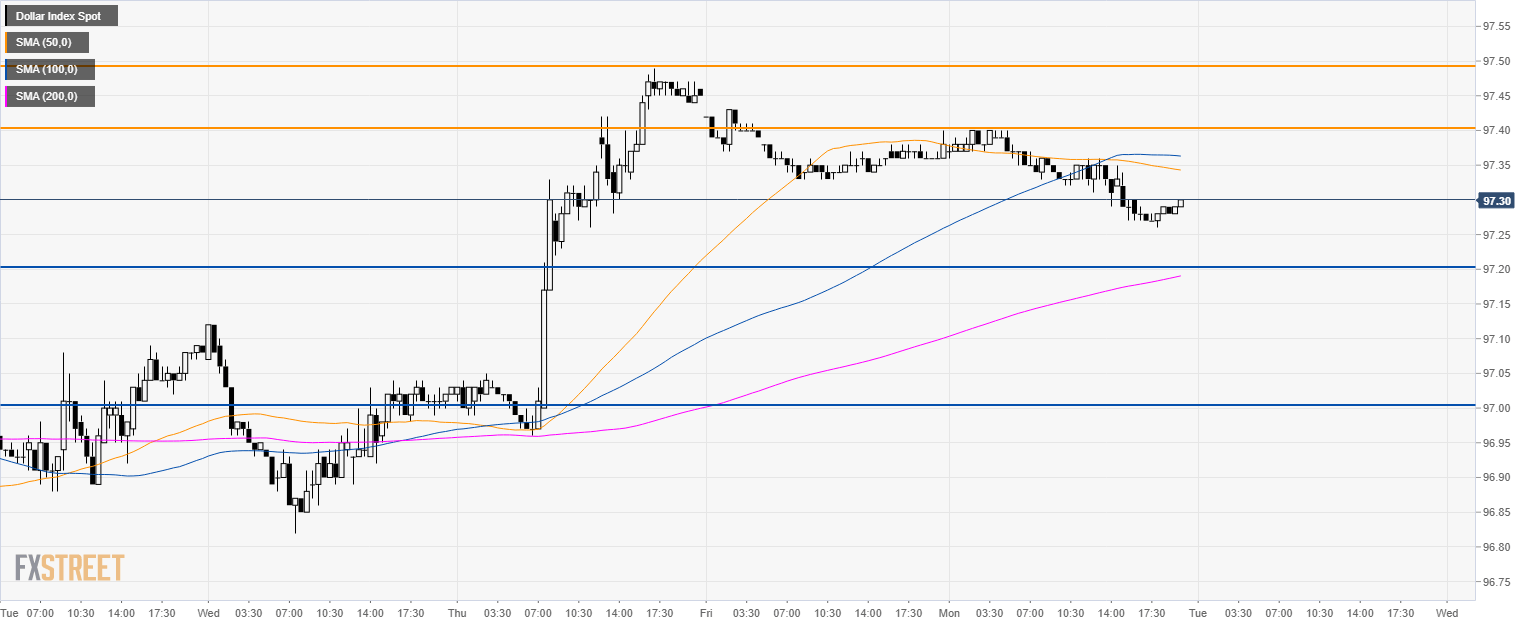
DXY 30-minute chart
- Bulls would need to overcome 97.40/50 resistances if they want to revisit the 2019 high at 97.70.
- As the market is trading below its 50 and 100 SMA, DXY is most likely going to revisit 97.20 and 97.00 key support during the week.
Additional key levels
