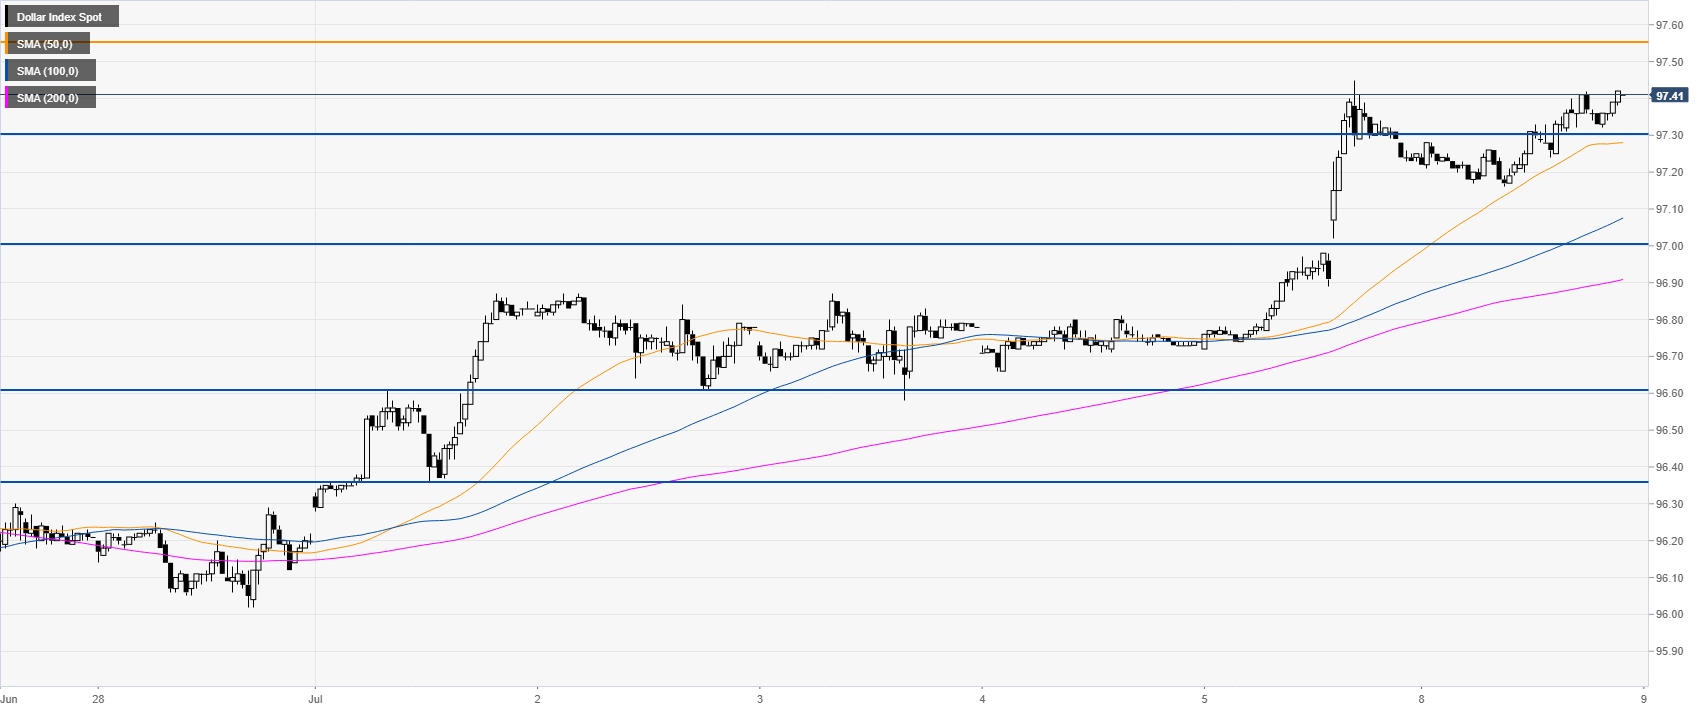
- The next resistance to the upsde is the 97.55 level
- The key support is located at the 97.00 figure.
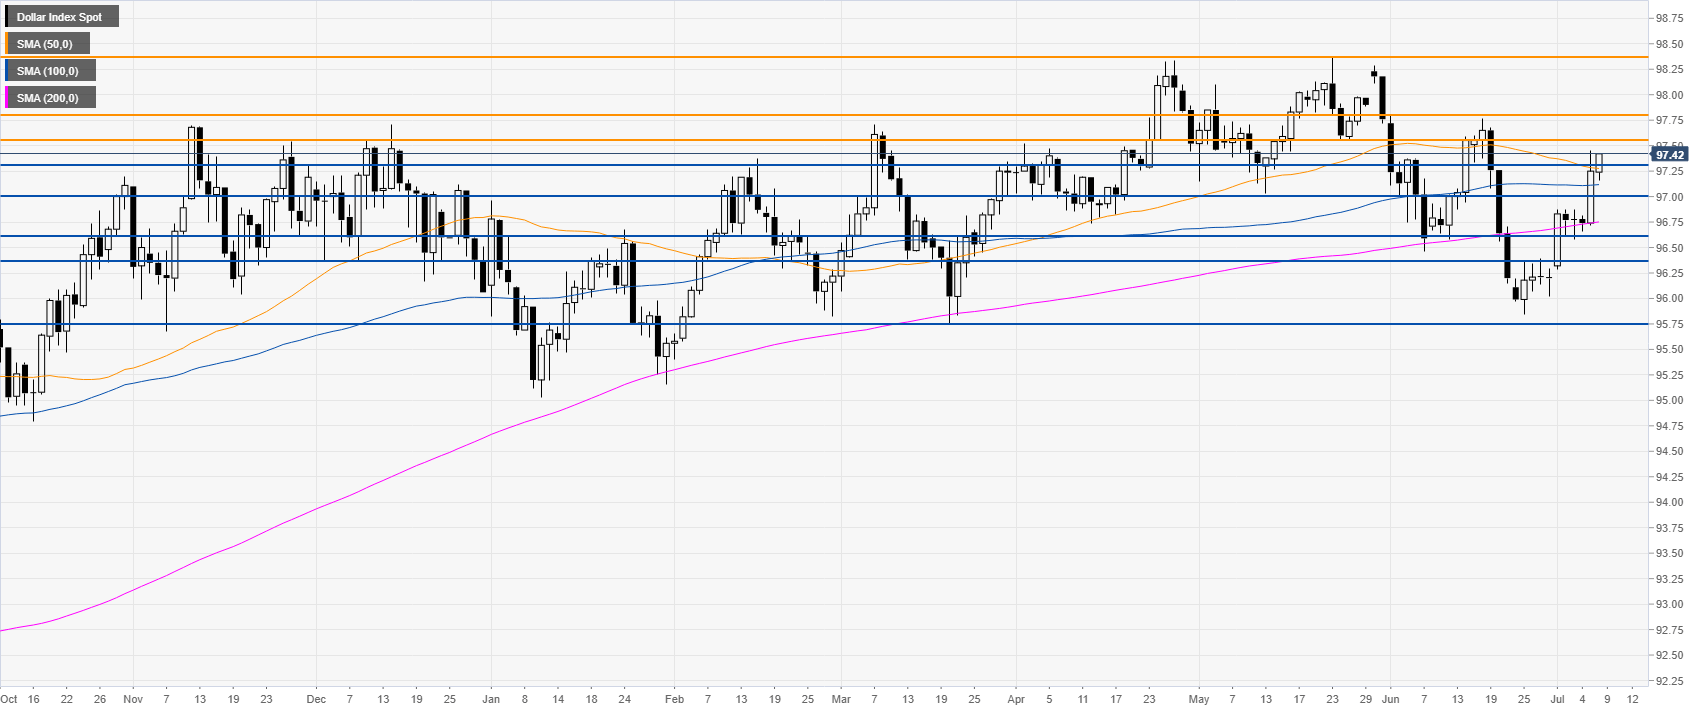
DXY daily chart
The US Dollar Index (DXY) is trading in a bull trend just above its main daily simple moving average (DSMA). The market is about to close the day above the 97.30 level which is seen as bullish.
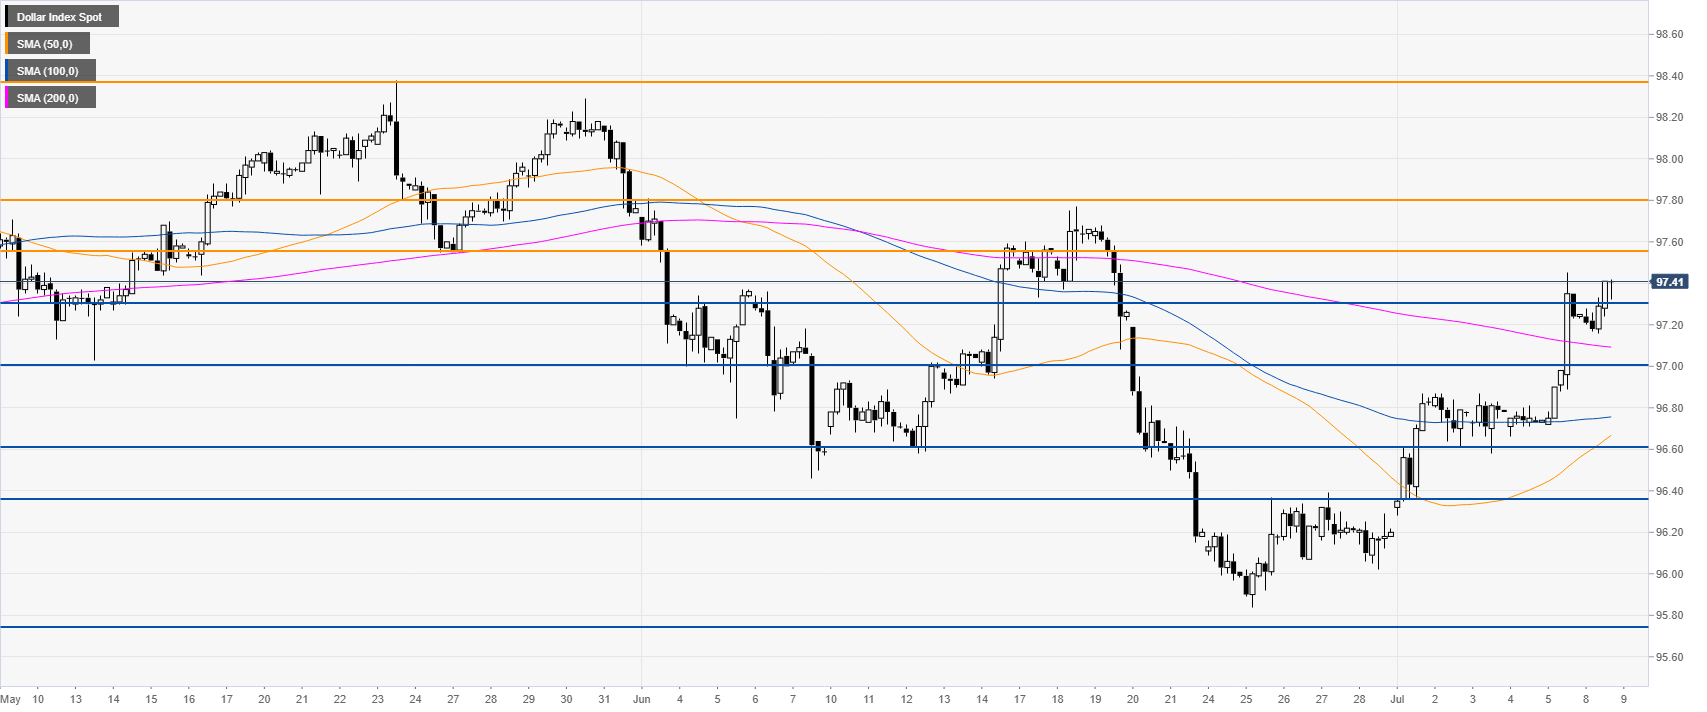
DXY 4-hour chart
The market is trading above its main SMAs suggesting bullish momentum in the medium term. Bulls will try to lift the market towards 97.55, 97.80 and 98.38.

DXY 30-minute chart
DXY is bullish in the short term above its main SMAs. 97.30 and 97.00 can be seen as immediate support. On the flip side, a daily close below 97.00 could lead to move down to 96.36.
Additional key levels