- The US Dollar Index (DXY) almost reached the 97.80 resistance.
- The 2019 high at 98.37 remains on the bulls radar.
The Greenback is starting the week strong. Bullish investors will be scrutinizing the FOMC report on Wednesday. If the Federal Reserves seems not to be in a hurry to cut interest rates it might be perceived as bullish by the market.
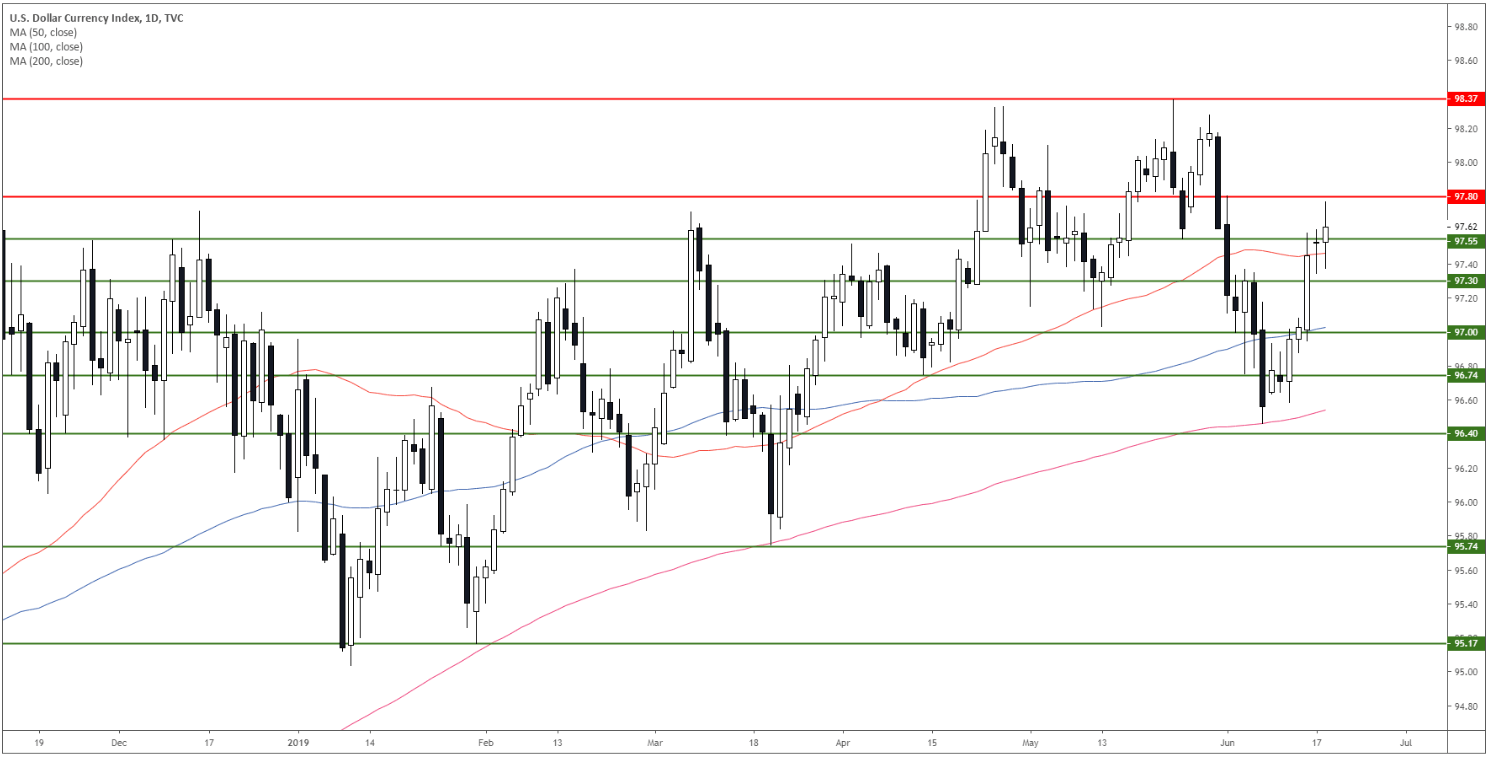
DXY daily chart
The US Dollar Index (DXY) is trading in a bull trend above its main daily simple moving averages (DSMA). The market found some resistance just below the 97.80 resistance.

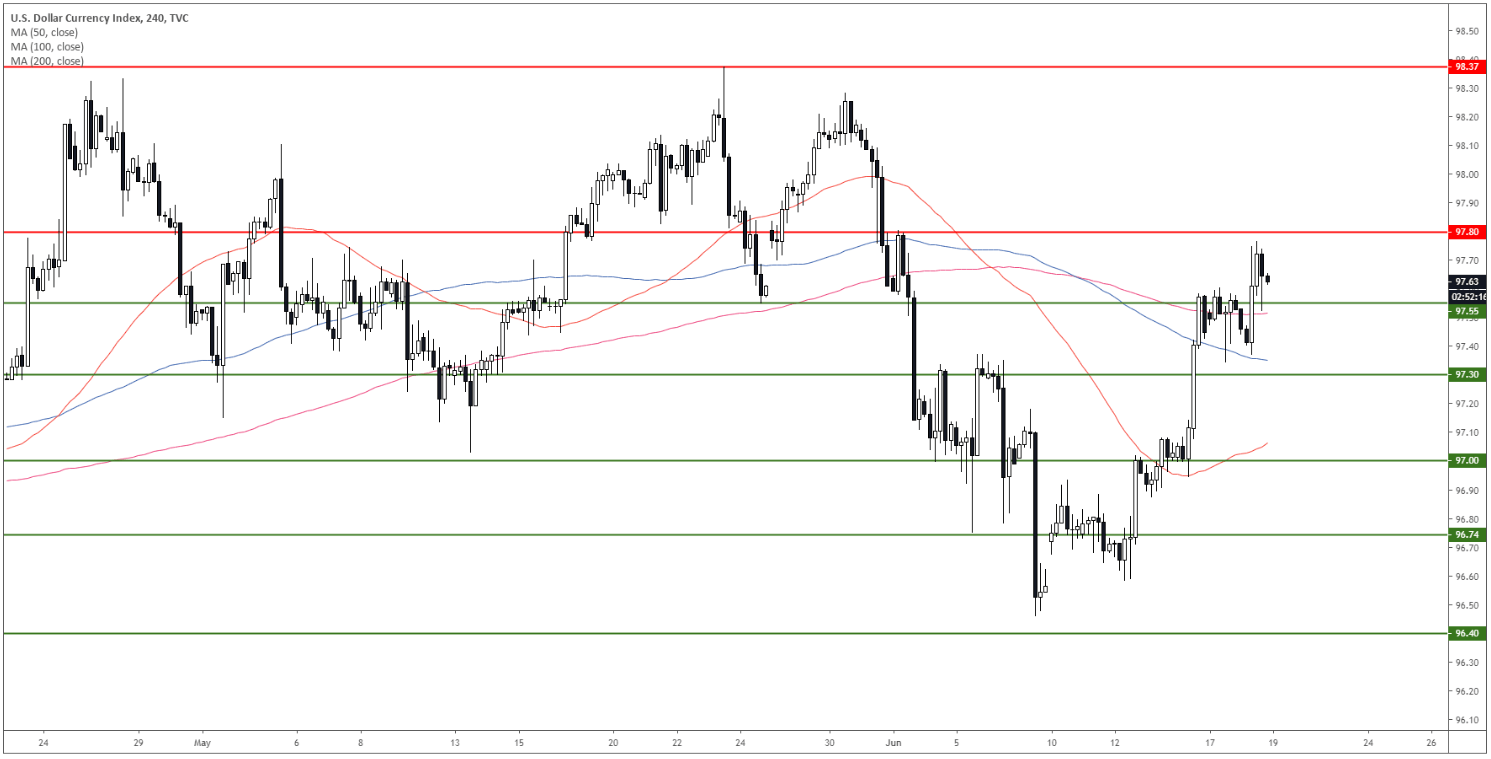
DXY 4-hour chart
DXY had another push to the upside as the market is trading above its main SMAs. The level to beat for bulls is at 97.80. If broken the market can potentially leap to 98.37 the 2019 high.
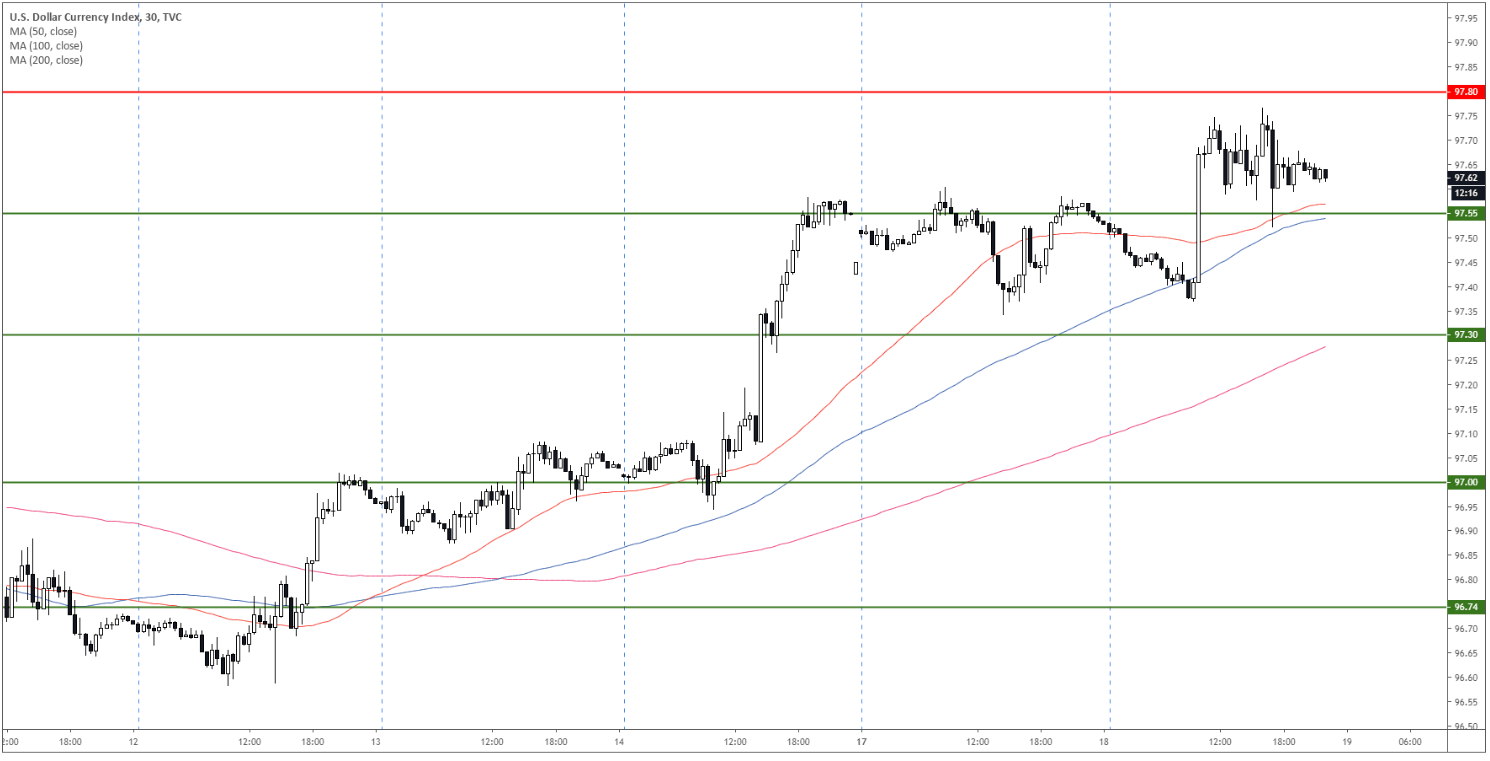
DXY 30-minute chart
The greenback is trading above its main SMAs suggesting bullish momentum in the near term. Immediate support is at 97.55 and 97.30.
Additional key levels
