- The Greenback is trading near the daily highs in a mixed trading session.
- The level to beat for bulls is the 99.10 resistance.
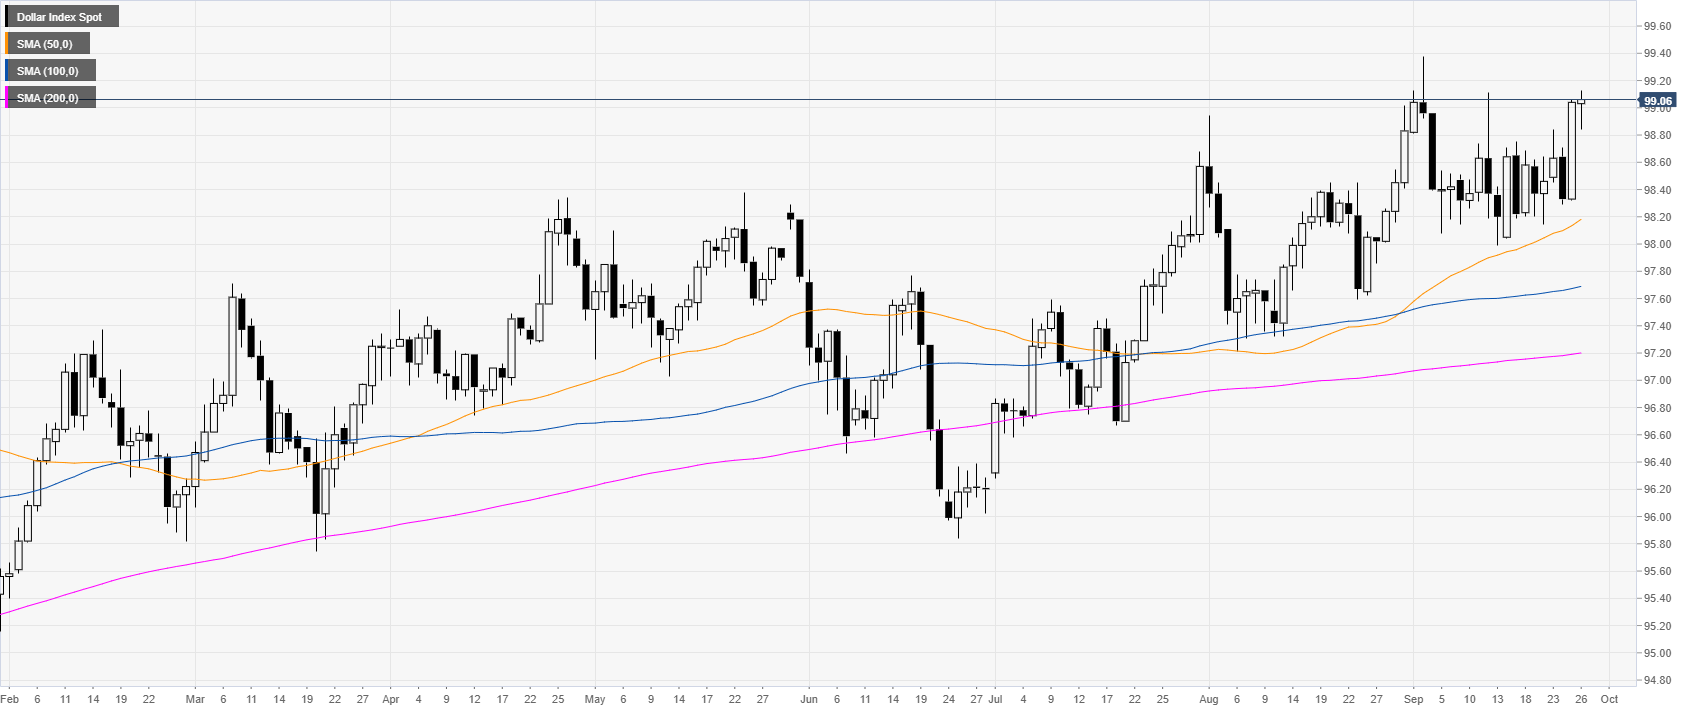
DXY daily chart
DXY (US Dollar Index) is trading in a bull trend above its main daily simple moving averages (DSMAs). The market is nearing the 2019 high at 99.38.
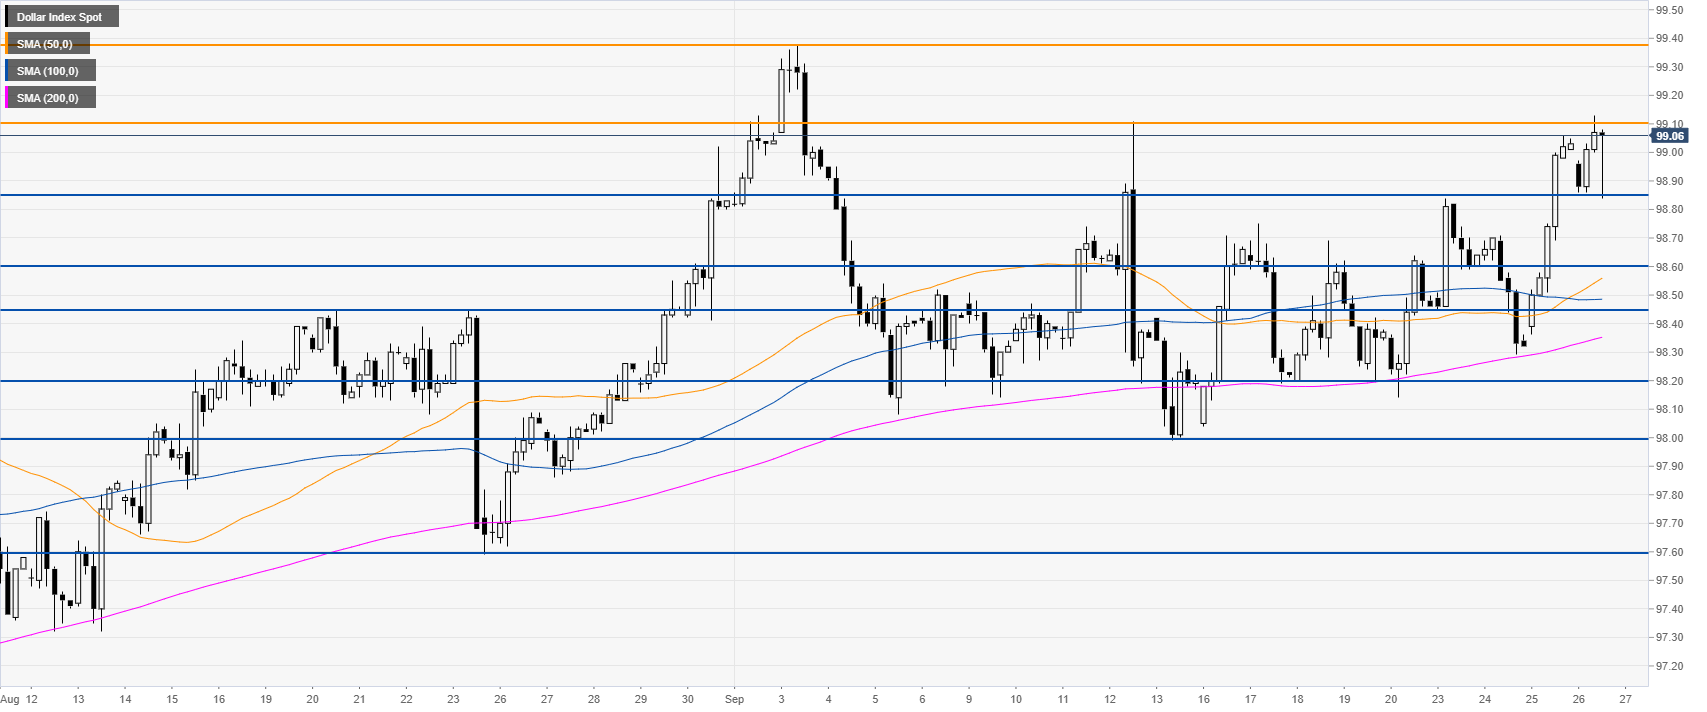
DXY four-hour chart
DXY rose to the 99.10 resistance as the market is trading above the SMAs. A break above the 99.10 resistance would expose the 2019 high at 99.38.
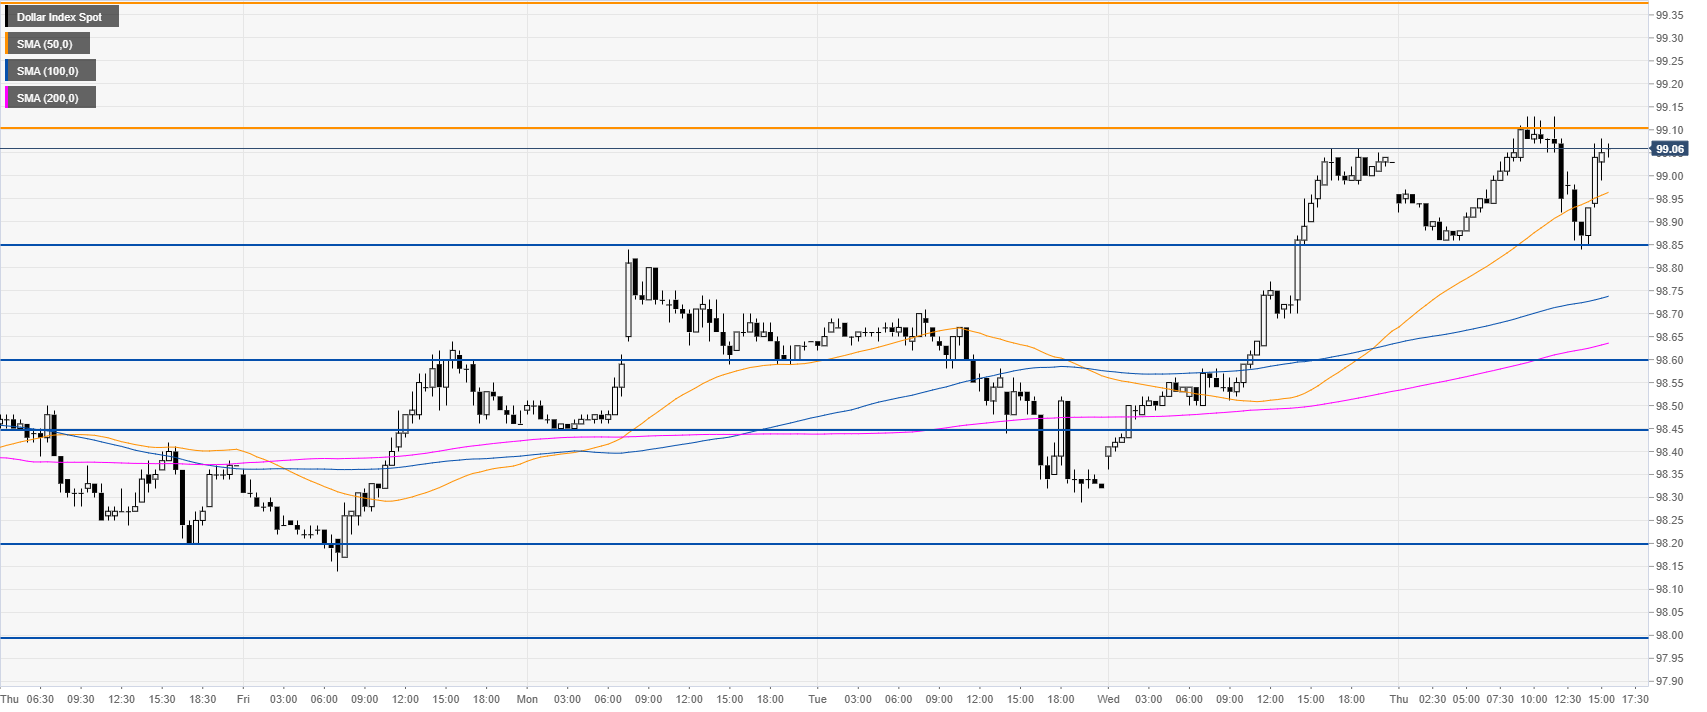
DXY 30-minute chart
DXY is trading above its main SMAs, suggesting bullish momentum in the short term. Bulls need to break the 99.10 strong resistance. On the way down, support is seen at the 98.85 and 98.60 price level.
Additional key levels
