- The US Dollar Index (DXY) bull trend is at risk.
- Resistance is seen at the 96.46 and 96.74 levels.
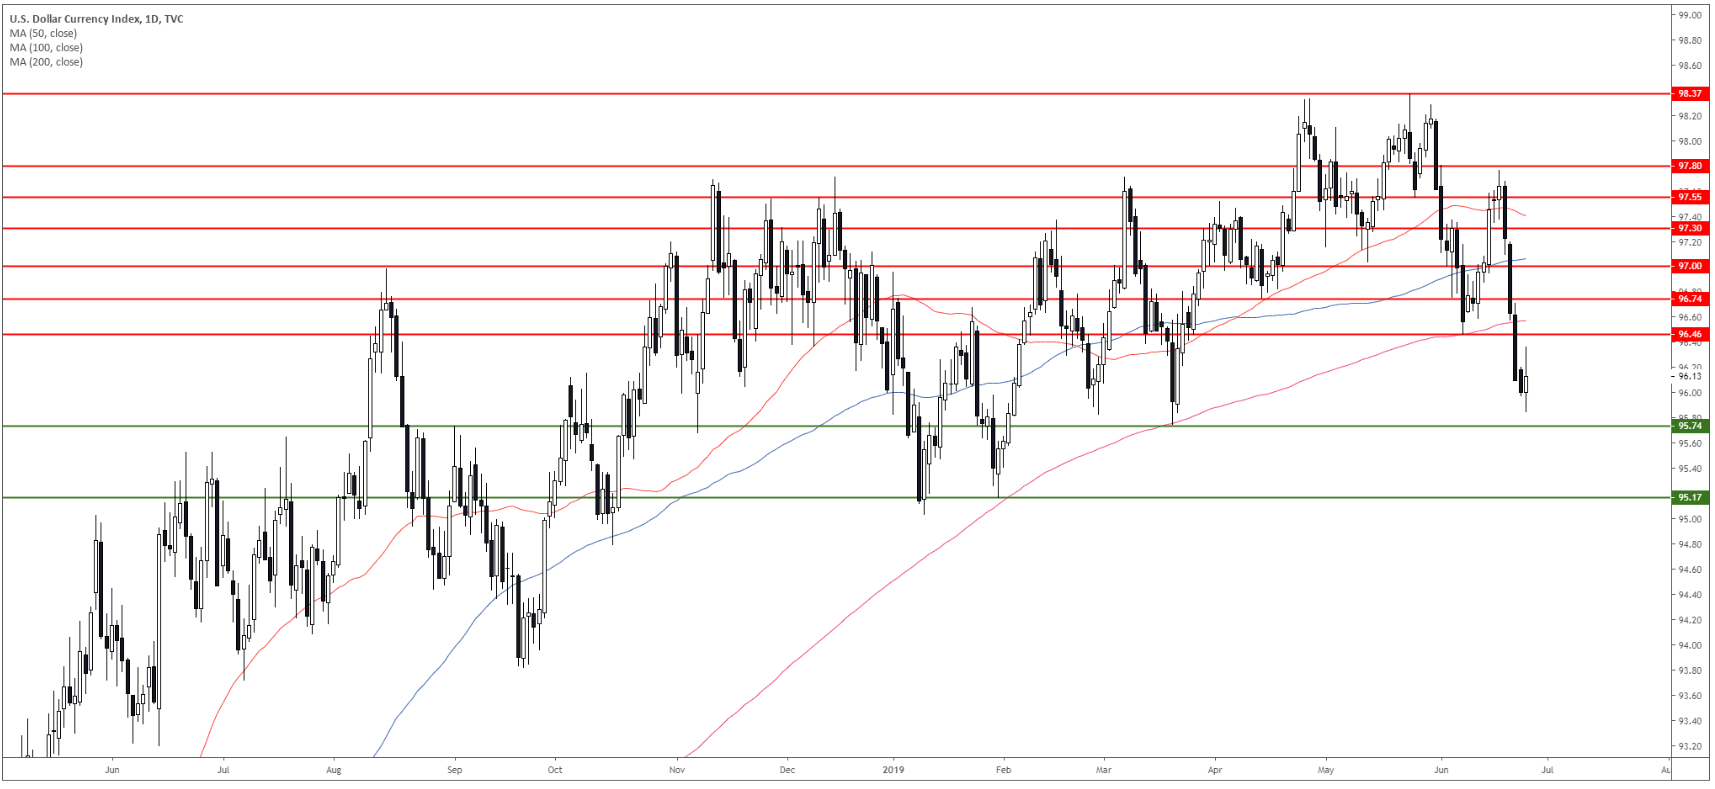
DXY daily chart
The US Dollar Index (DXY) broke below 96.46 key support and the 200-day simple moving average (DSMA) putting the bull trend at risk.
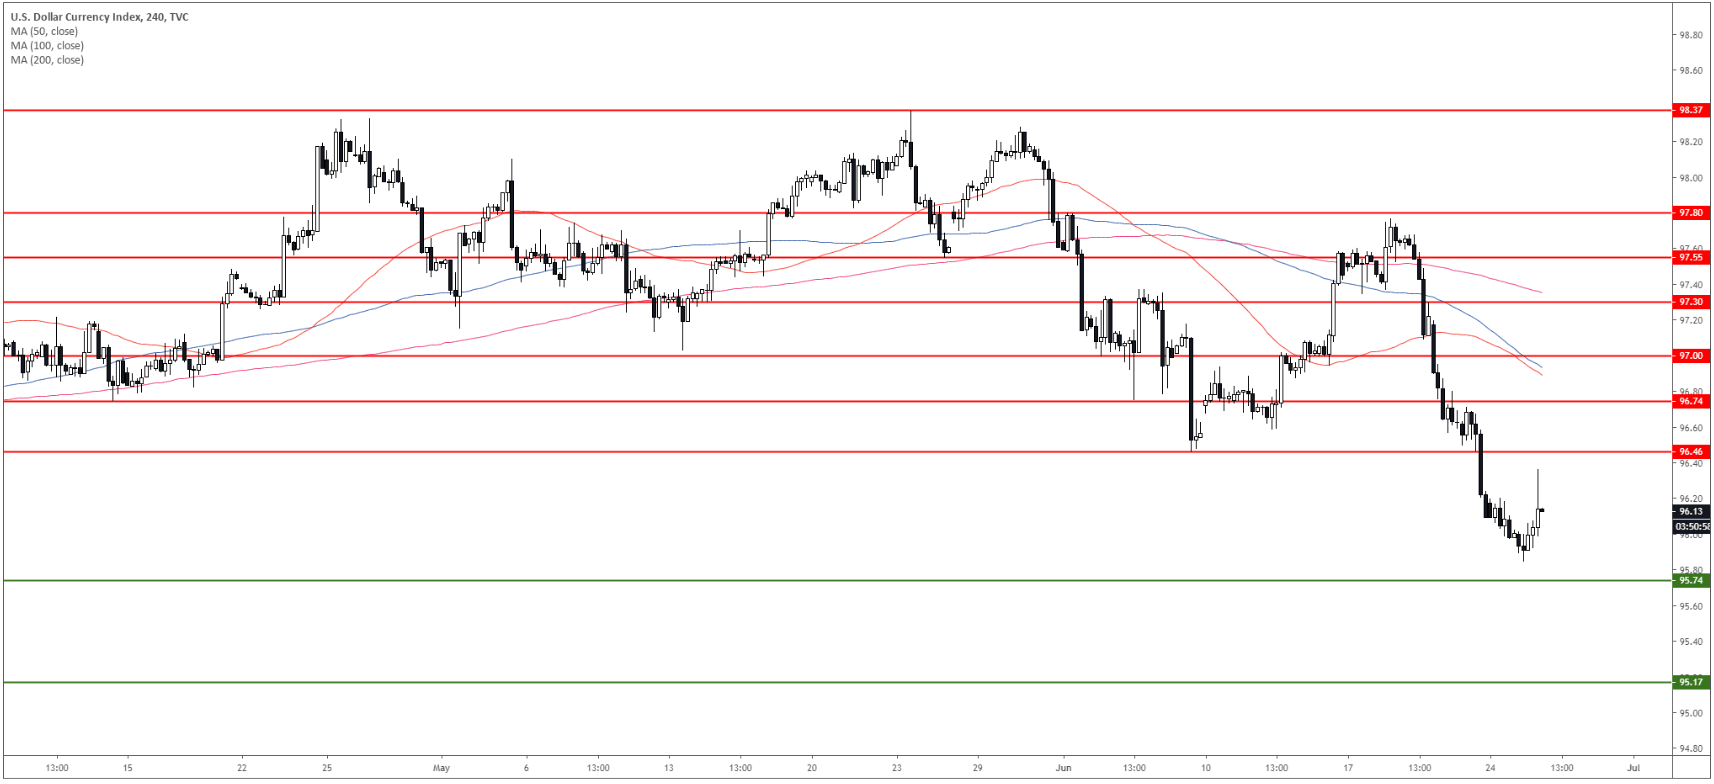
DXY 4-hour chart
DXY is under pressure below its main SMAs suggesting bearish momentum in the near term. Bears can reach to 95.74 and 95.17 to the downside. Resistance is at 96.46 and 96.74.

DXY 30-minute chart
The market is correcting up above the 50 and 100 SMAs. DXY remains under pressure below the 96.46 resistance. 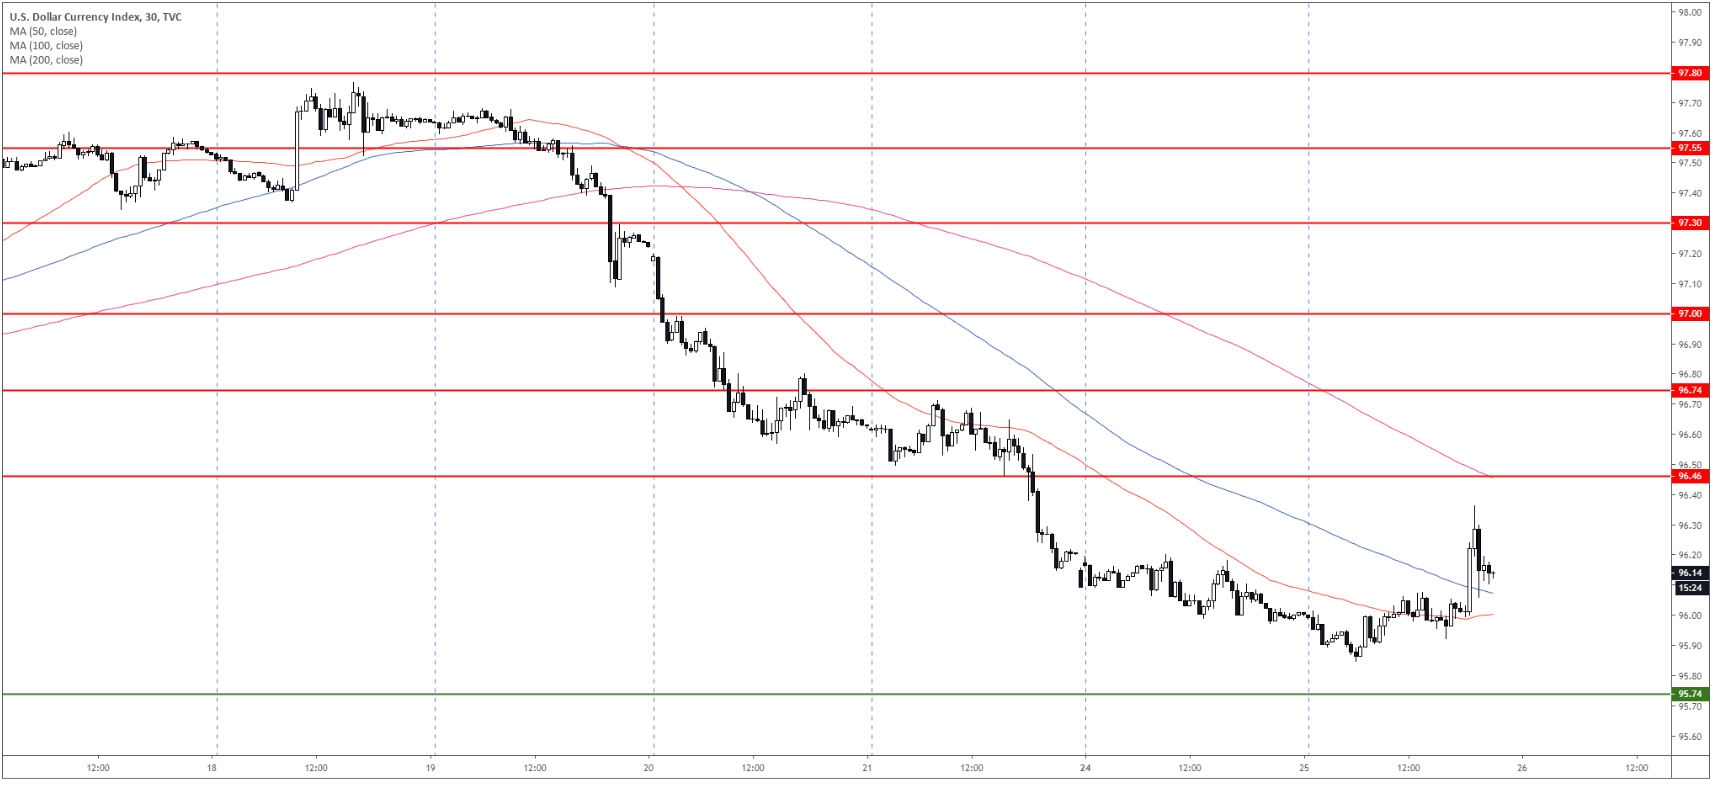
Additional key levels
