- The Greenback is trading in the 99.63-99.00 band at the start of the week.
- The uptick after the London close was mainly due to some positive trade war headlines.
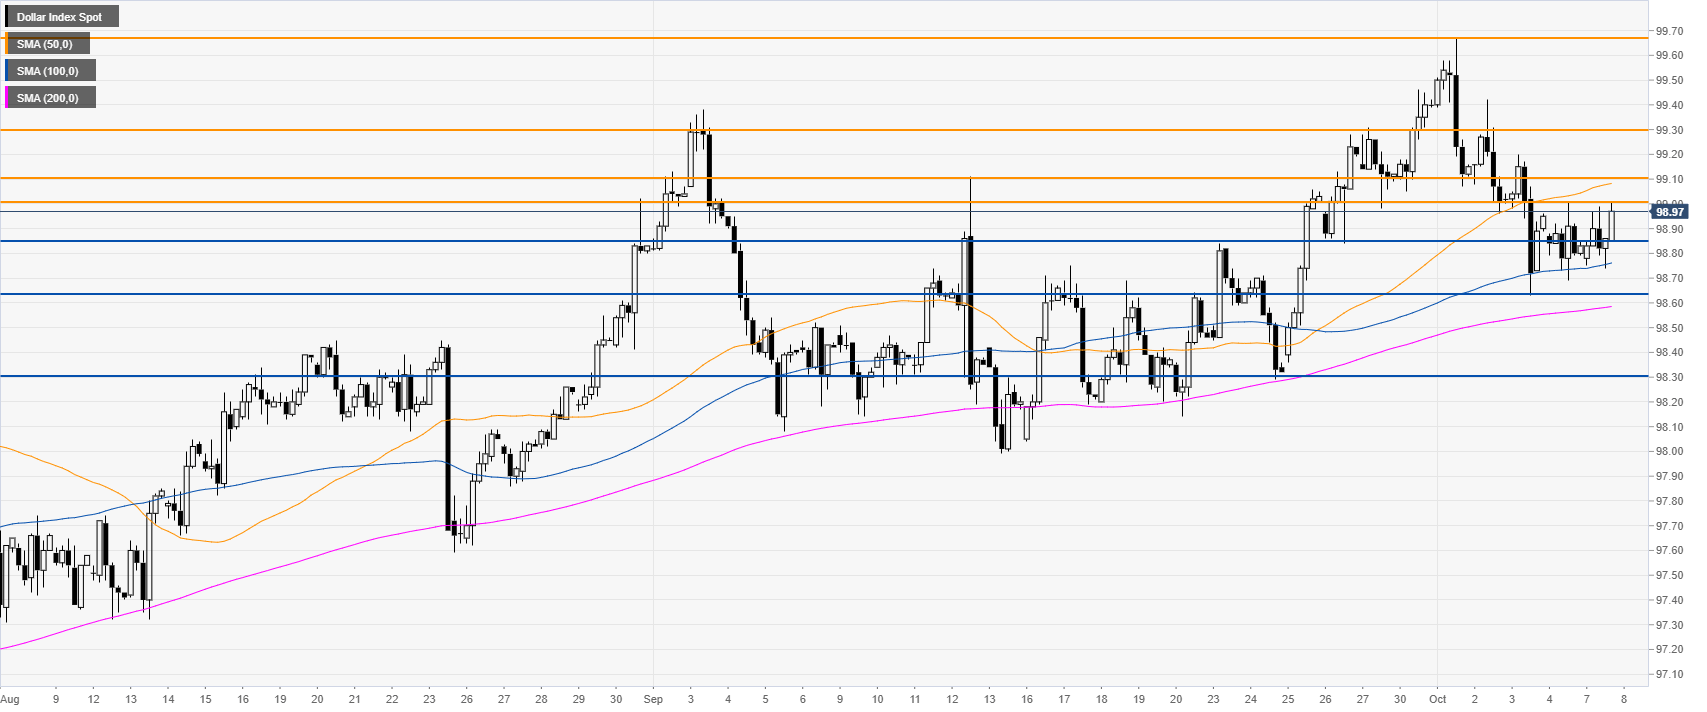
DXY daily chart
The US Dollar Index (DXY) is trading in a bull trend above the main daily simple moving averages (DSMAs). This Monday, DXY gains some modest momentum on positive trade war-related headlines.

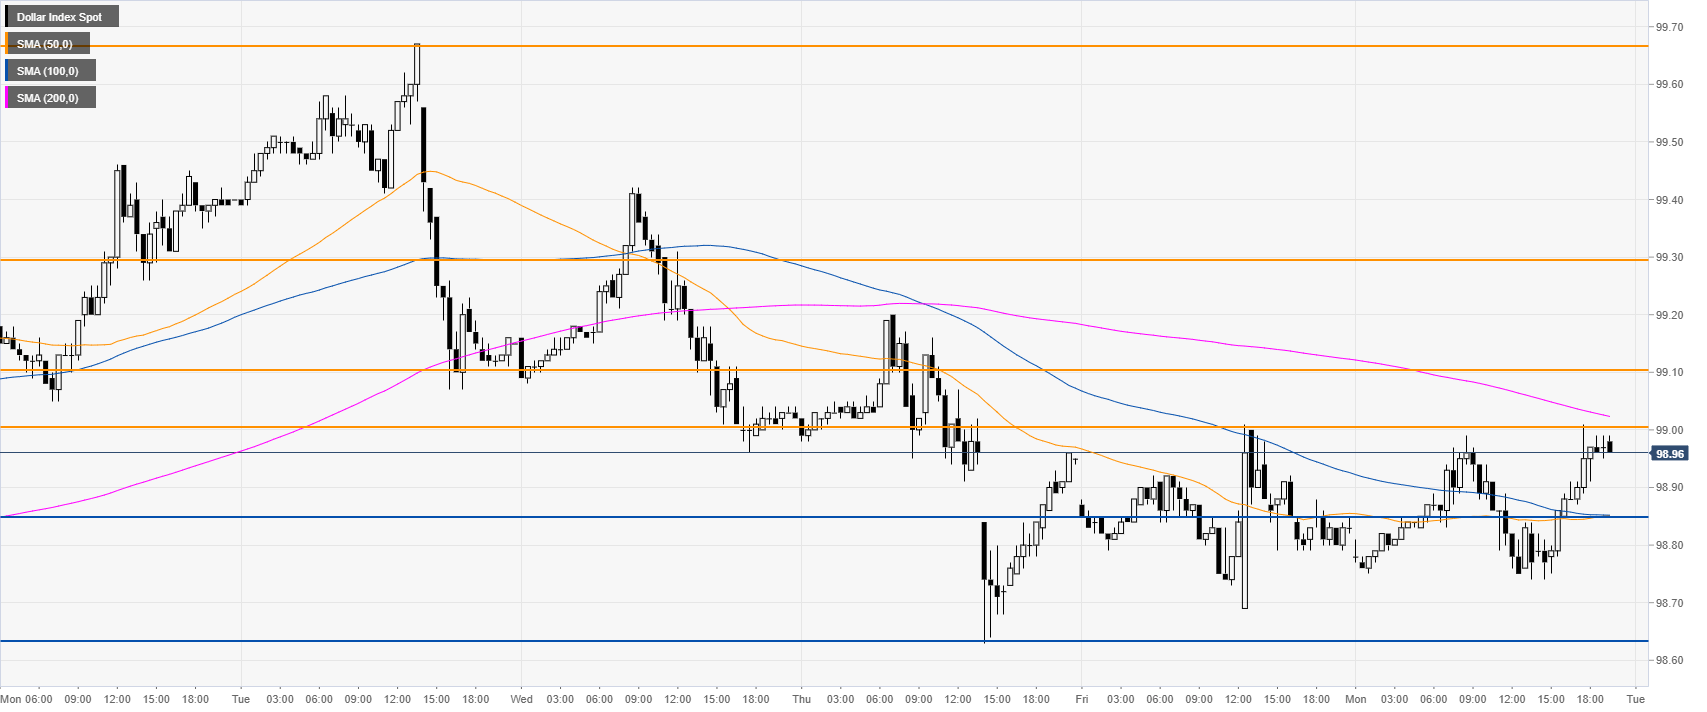
DXY four-hour chart
DXY is in a trading range in the 98.63-99.00 band while trading between the 50 and 100 SMAs. The Index remains in an uptrend above the 200 SMA and a break of the 99.00/99.10 resistance zone can lead to 99.30 resistance in the medium term.
DXY 30-minute chart
DXY is trading between the 100 and 200 SMA, suggesting a consolidation in the short term. Support is seen at the 98.85 and 98.63 price levels.
Additional key levels
