- DXY is trading in a range this Friday and is ending the week 0.60% down.
- The US Non-Farm Payrolls came below expectations at 136K vs. 145K in September, while wages came out at 2.9% vs. 3.2% forecast.
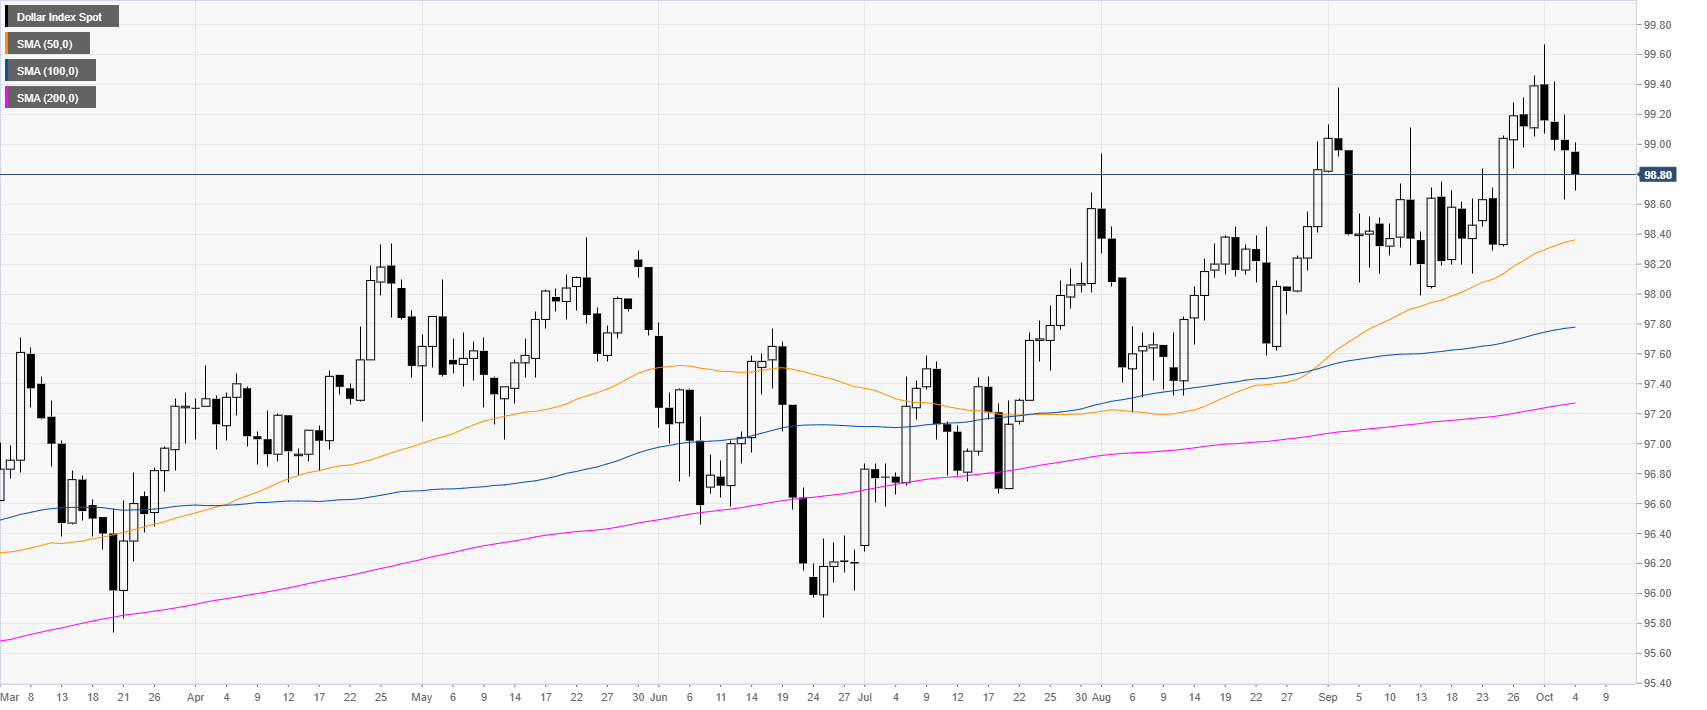
DXY daily chart
The US Dollar Index (DXY) is trading in a bull trend above the main daily simple moving averages (DSMAs). This Friday, the US Non-Farm Payrolls came below forecast at 136K vs. 145K in September, while wages disappointed as well at 2.9% vs. 3.2% expected.
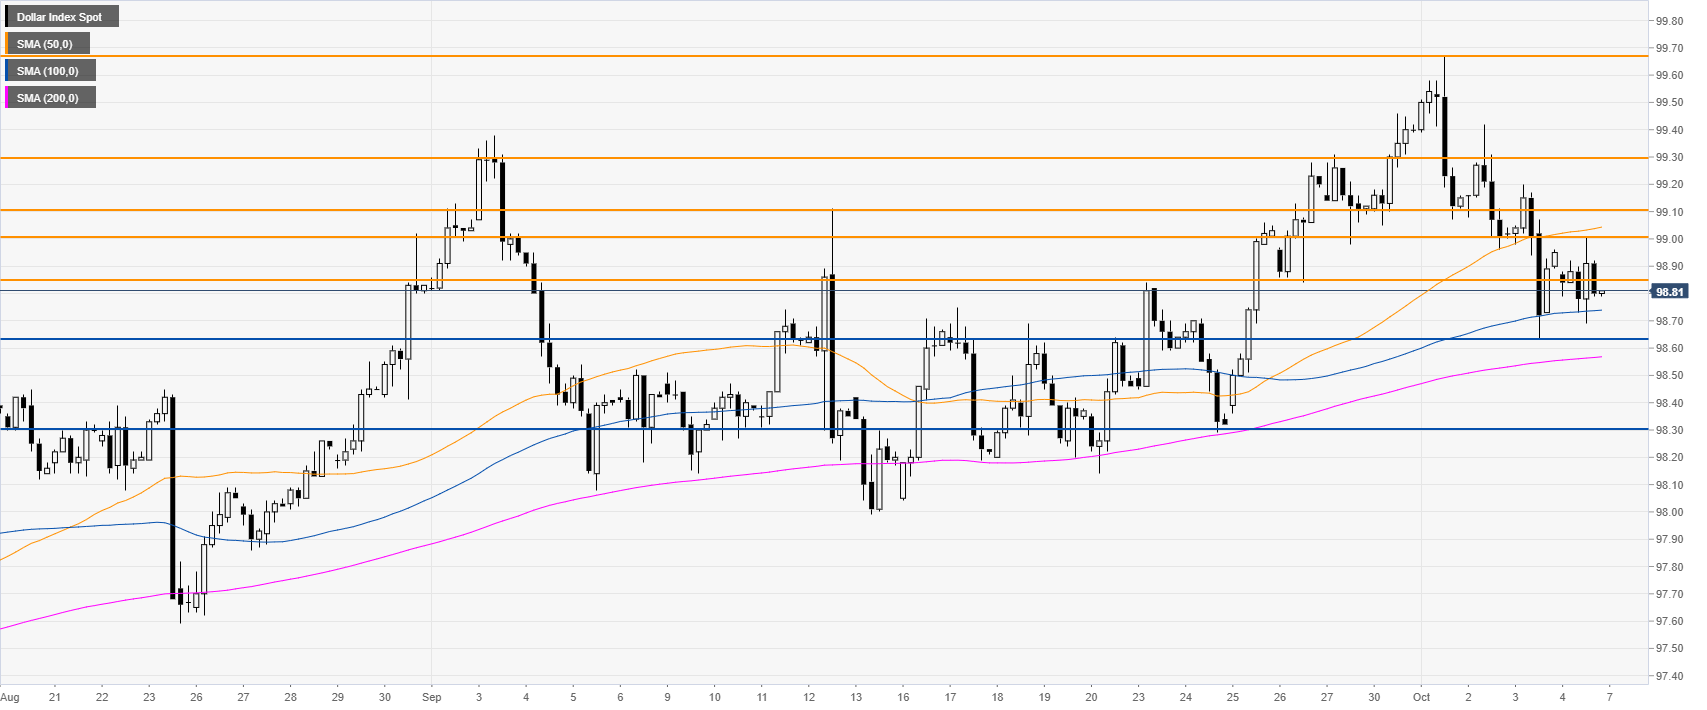
DXY four-hour chart
DXY is ranging in the 98.63-99.00 band between the 50 and 100 SMAs. The Index remains in a bull trend above the 200 SMA and a break of the 99.00/99.10 resistance zone could lead to 99.30 in the medium term.
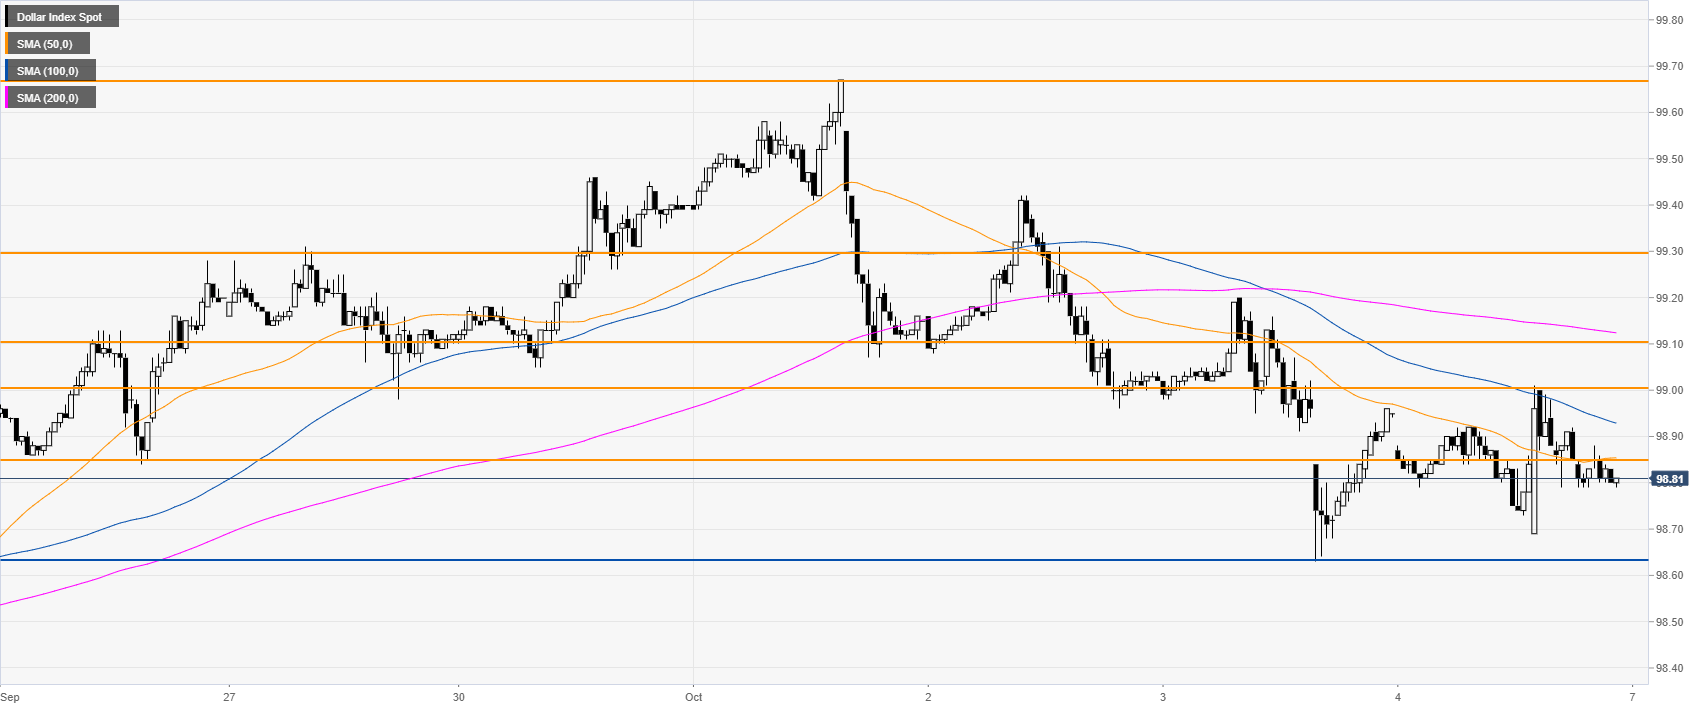
DXY 30-minute chart
DXY is trading below its main SMAs, suggesting a bearish bias in the short term. A break below 98.63 support can lead to 98.30 on the way down. The market would need to clear the 99.00-99.10 resistance zone in order to alleviate the bearish pressure.
Additional key levels
