- DXY breaks below the 97.00 figure and the 200 DSMA.
- The level to beat for bears is 96.60 and 96.36.
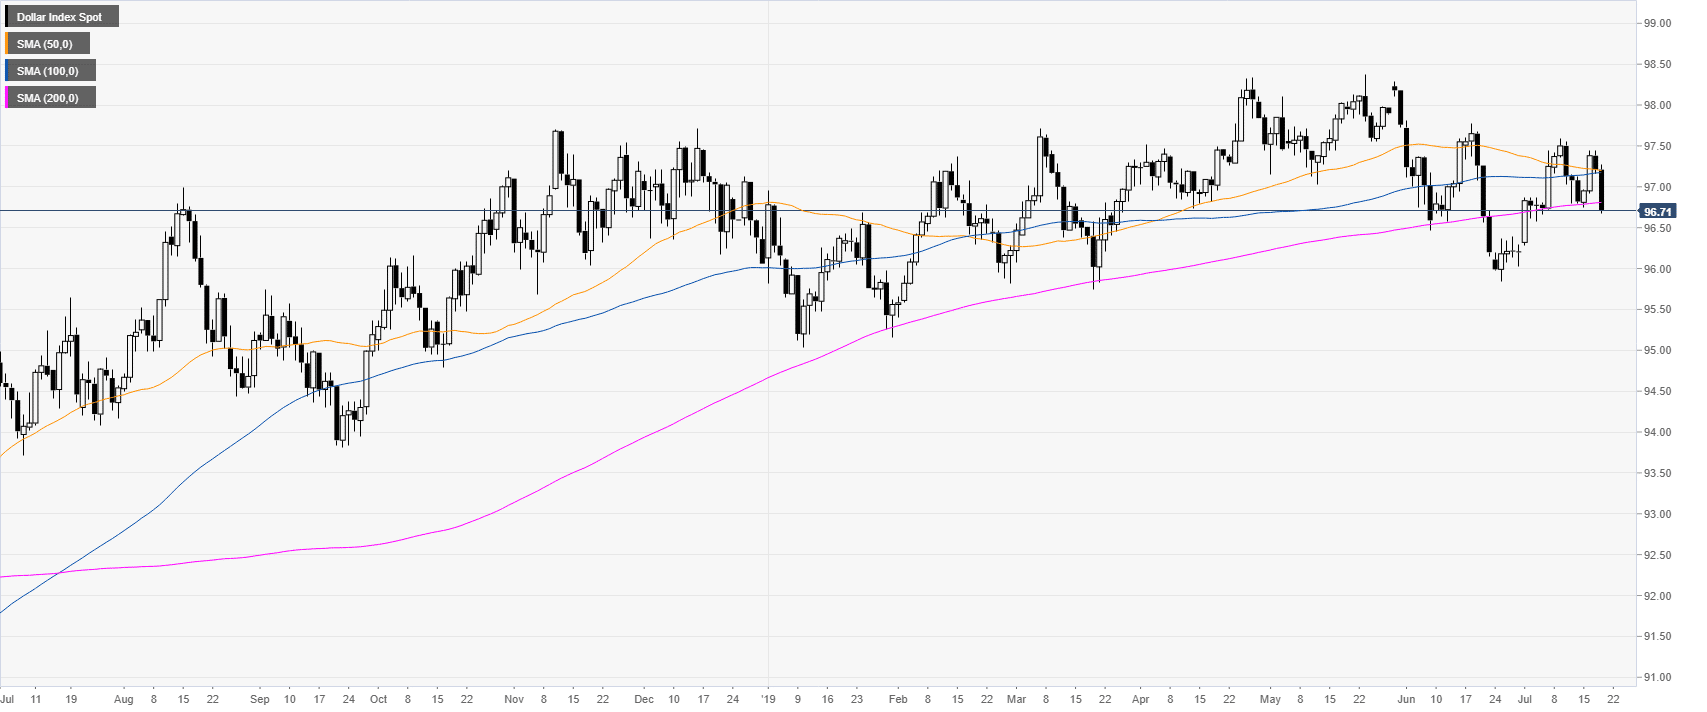
DXY daily chart
The US Dollar Index (DXY) broke below the 97.00 handle and the 200-daily simple moving average (DSMA).

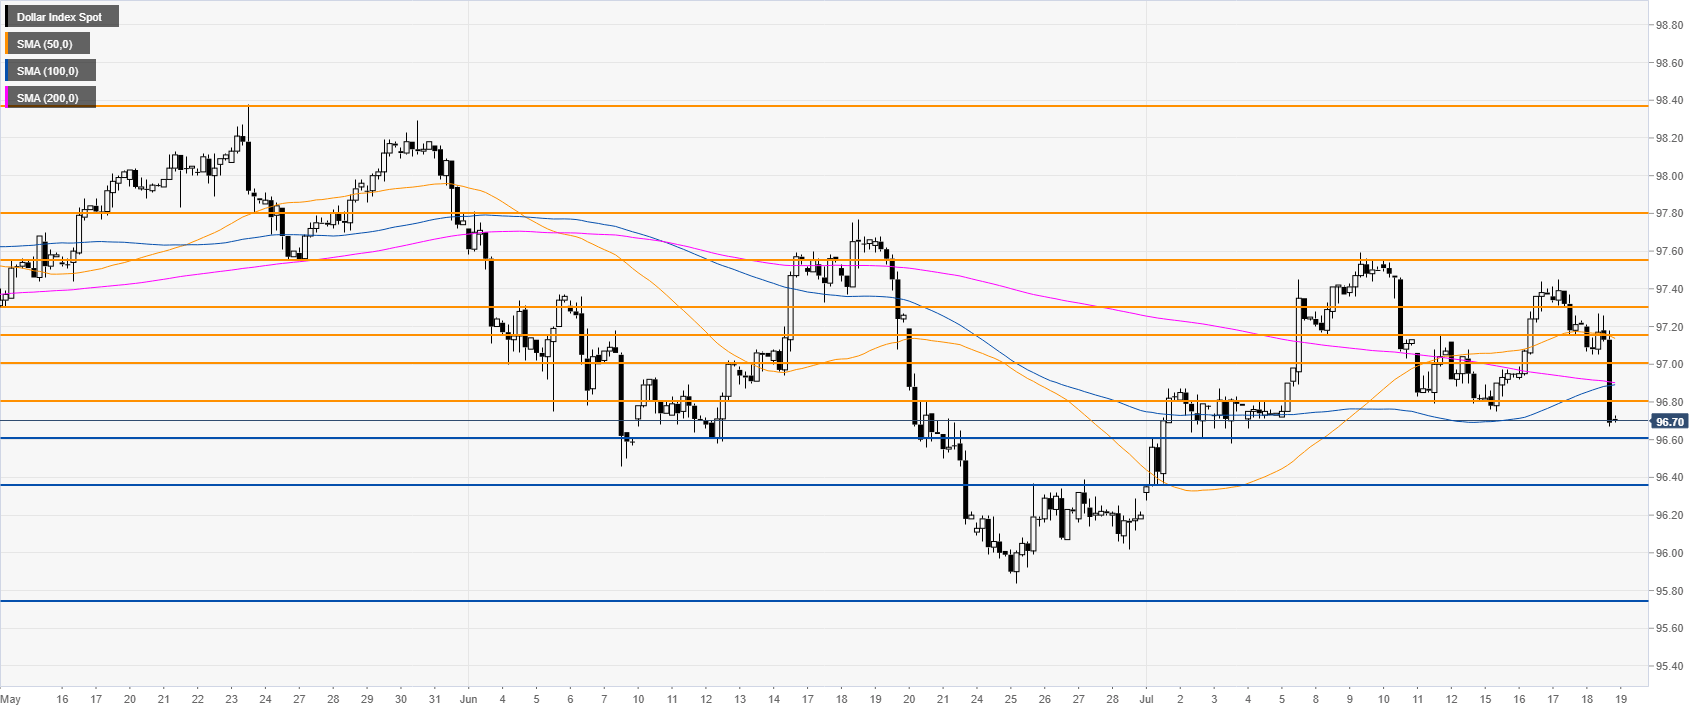
DXY 4-hour chart
The market is trading below its main SMAs suggesting bearish momentum in the medium term. Bears would need a break below 96.60 and 96.36.
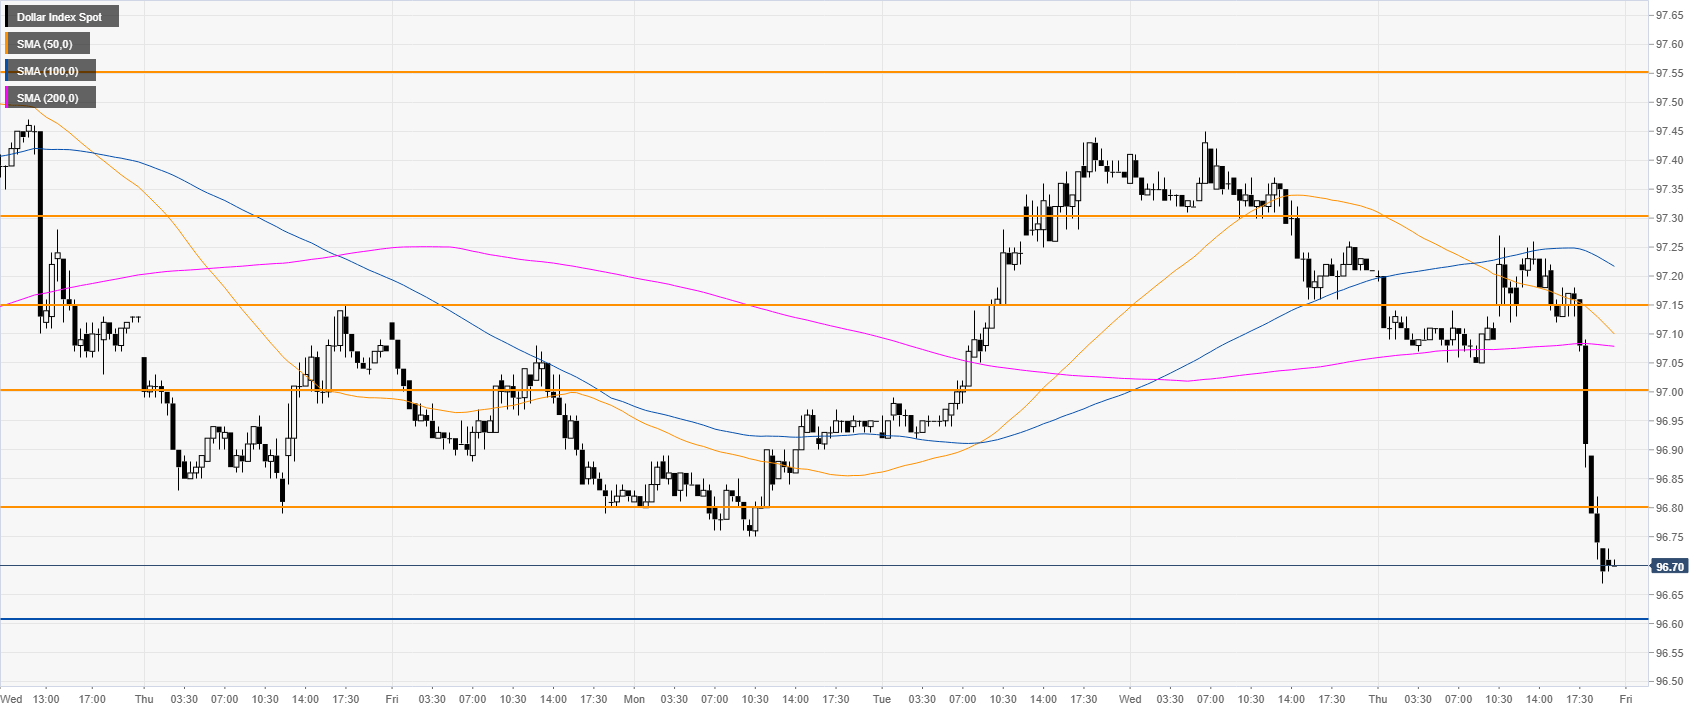
DXY 30-minute chart
The bears took the market by surprise and brought the index near the weekly lows. Resistances are seen at 96.80 and the 97.00 figure.
Additional key levels