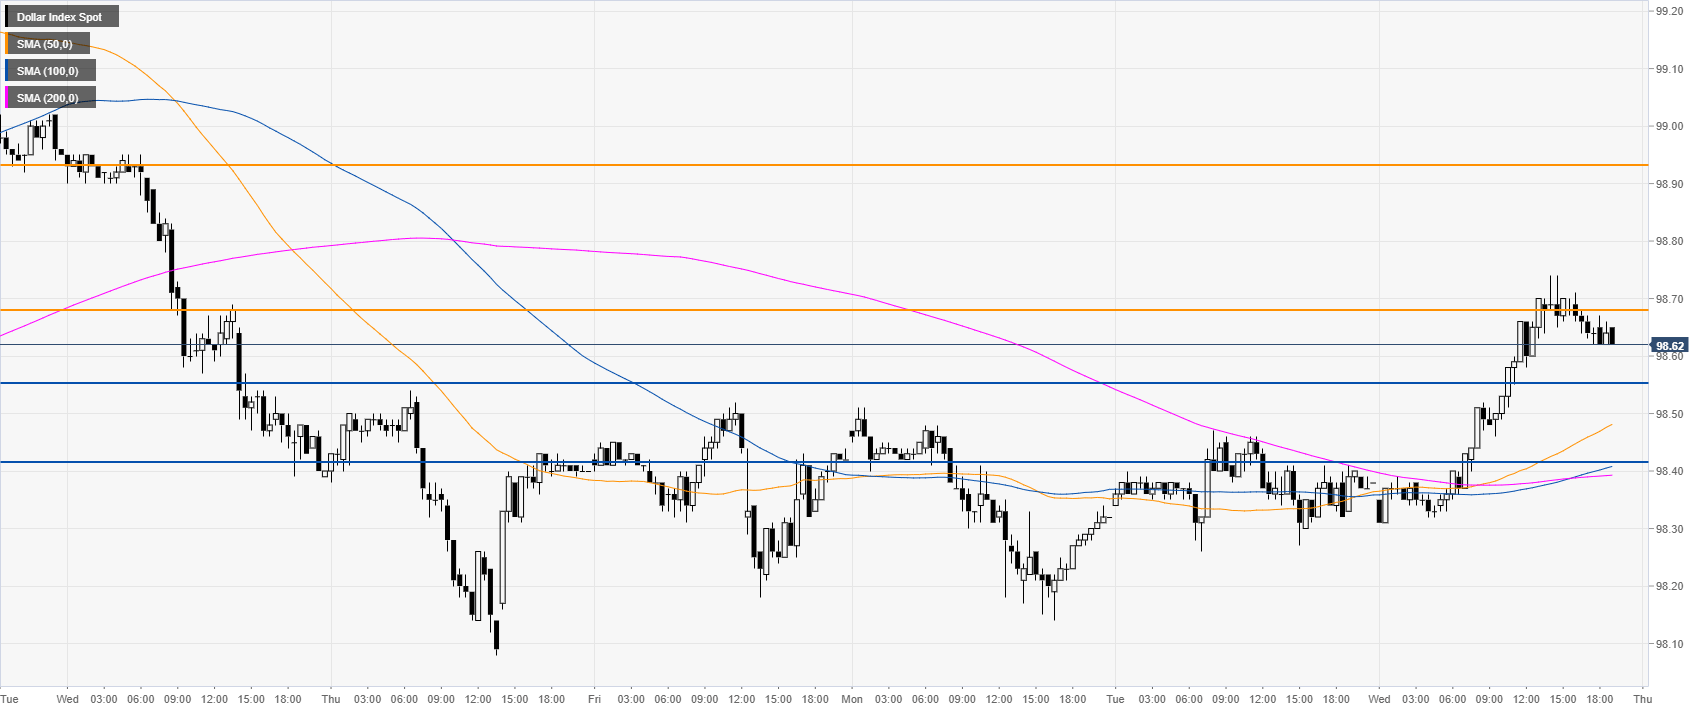
- DXY (US Dollar Index) ends Wednesday above the 98.55 level.
- The level to beat for bulls is at the 98.68 resistance level.
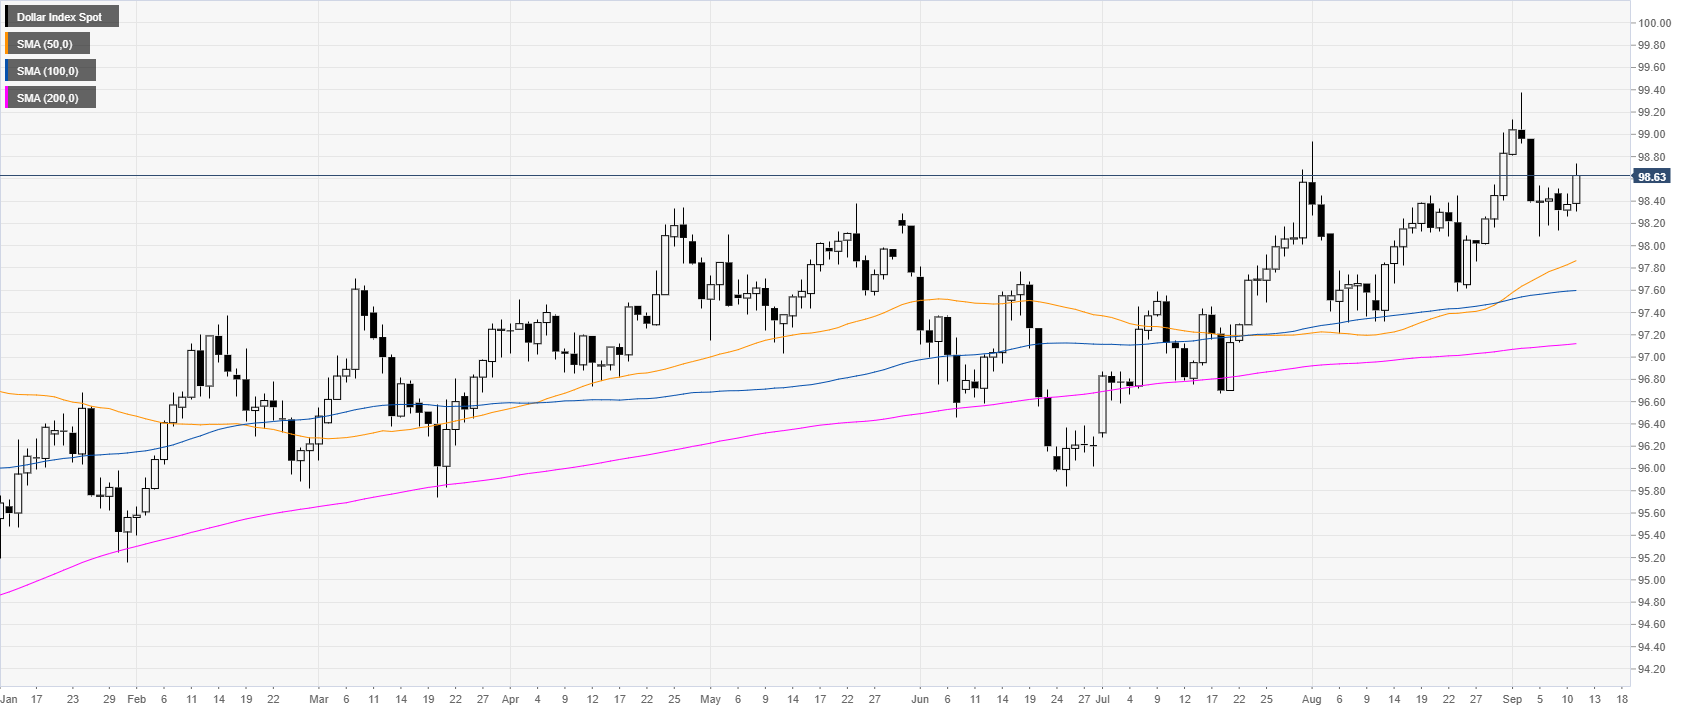
DXY daily chart
DXY (US Dollar Index) is trading in a bull trend above its main daily simple moving averages (DSMAs). The Greenback is rising as the 10-year US Bond Yields are trading at 3-week’s high.
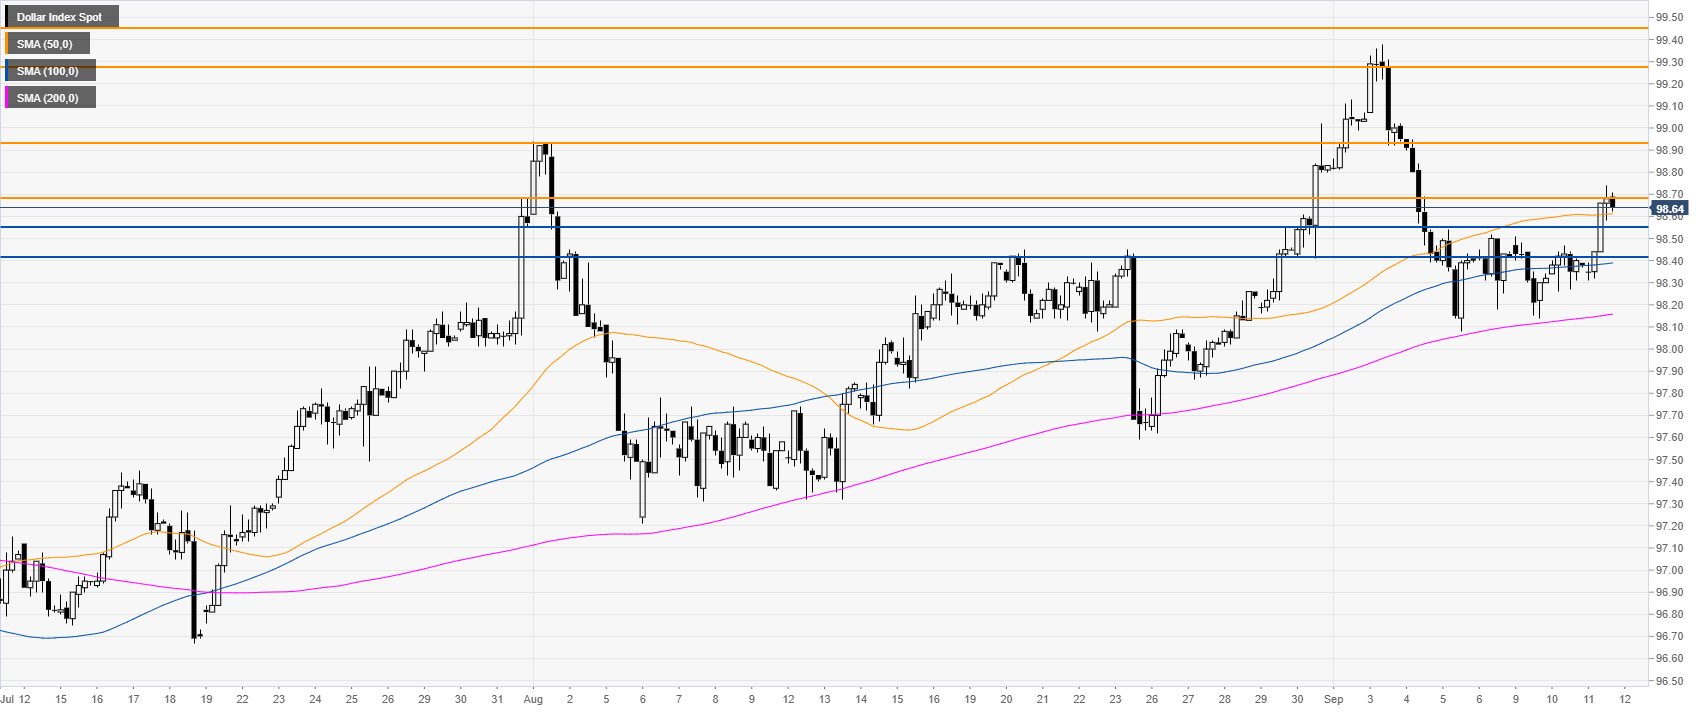
DXY four-hour chart
The US Dollar Index broke from its 4-day range and reached the 98.68 resistance level this Thursday. DXY bulls will be looking to extend the up move towards 98.94 resistance level as the market trades above its main SMAs. Further up lies the 99.28 resistance near the 2019 high.
DXY 30-minute chart
DXY is trading off the daily highs while above its main SMAs, suggesting bullish momentum in the near term. Immediate support is seen at the 98.55 and 98.42 price levels.
Additional key levels
