- DXY is turning slightly negative on the second day of the week.
- The level to beat for buyers is the 98.50 price level.
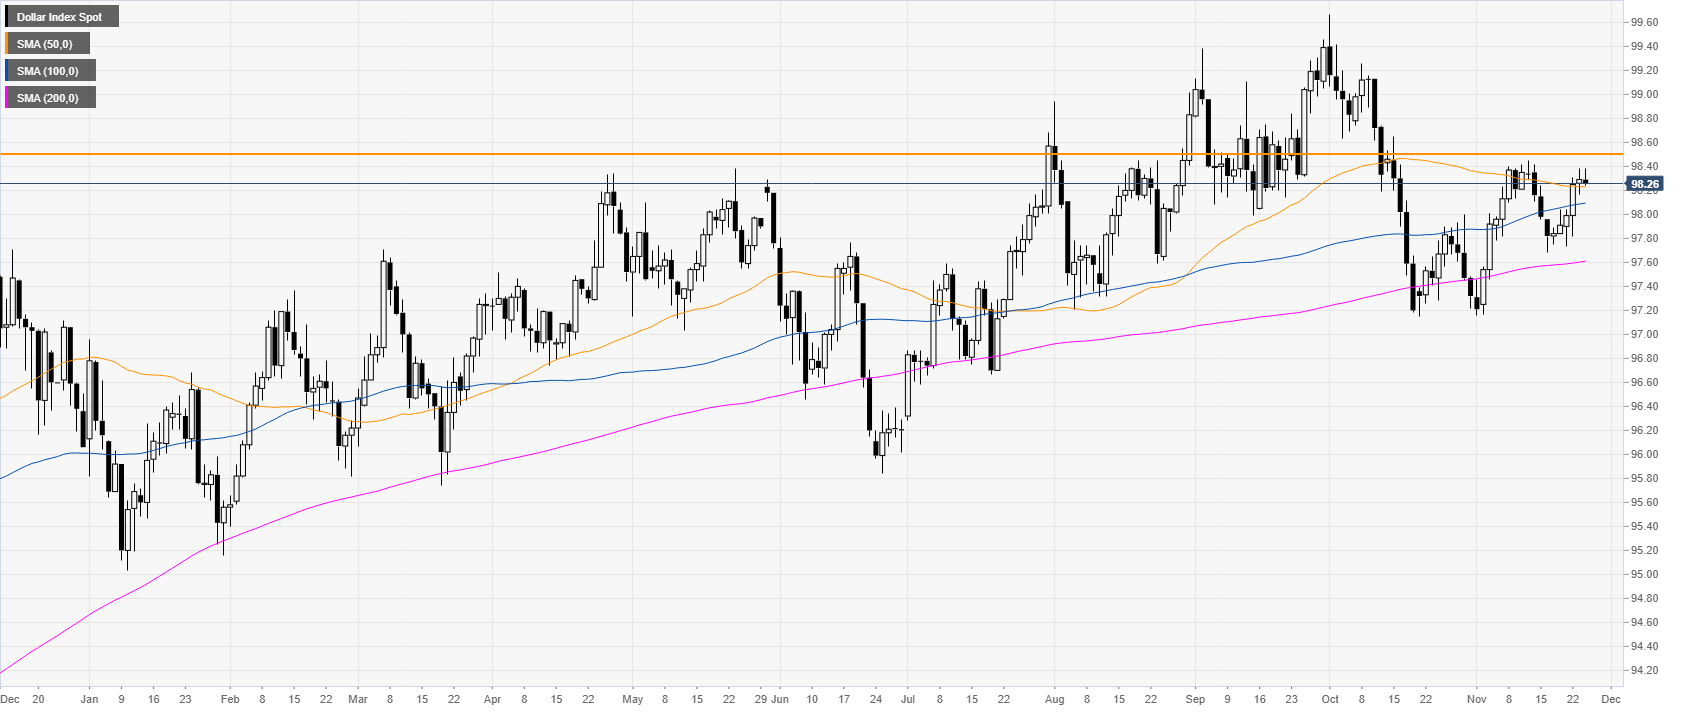
DXY daily chart
DXY (US Dollar Index) is trading in an uptrend above its main daily simple moving averages (DMAs). This Tuesday, DXY lost some ground, trading in a tight range below a critical resistance at the 98.50 level.
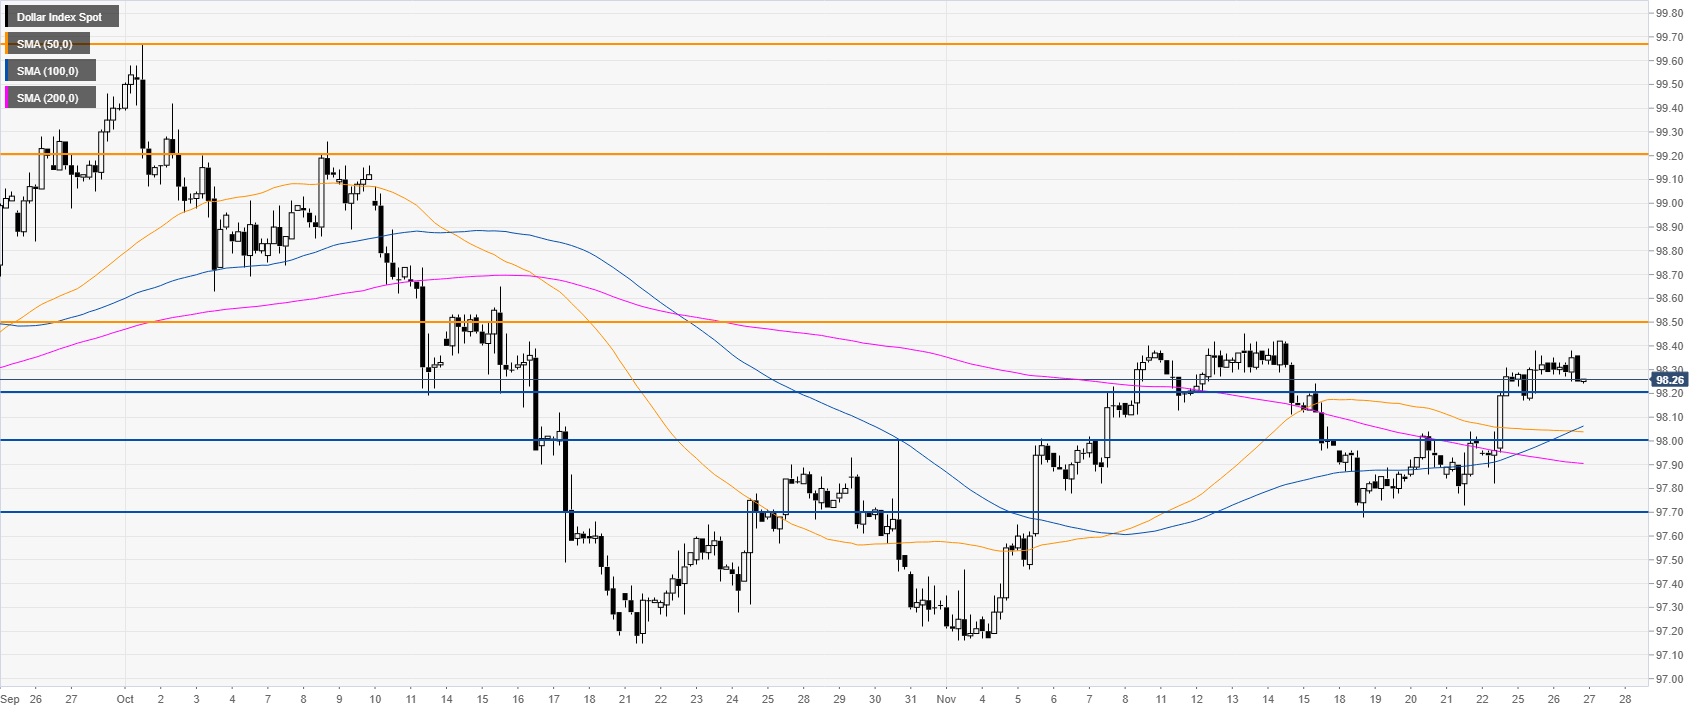
DXY 4-hour chart
DXY is trading above its main SMAs on the four-hour chart, suggesting a bullish momentum in the medium term. If the bulls break above the 98.50 level, the market could appreciate towards the 99.20 level and possibly to the 99.67 level (2019 high).
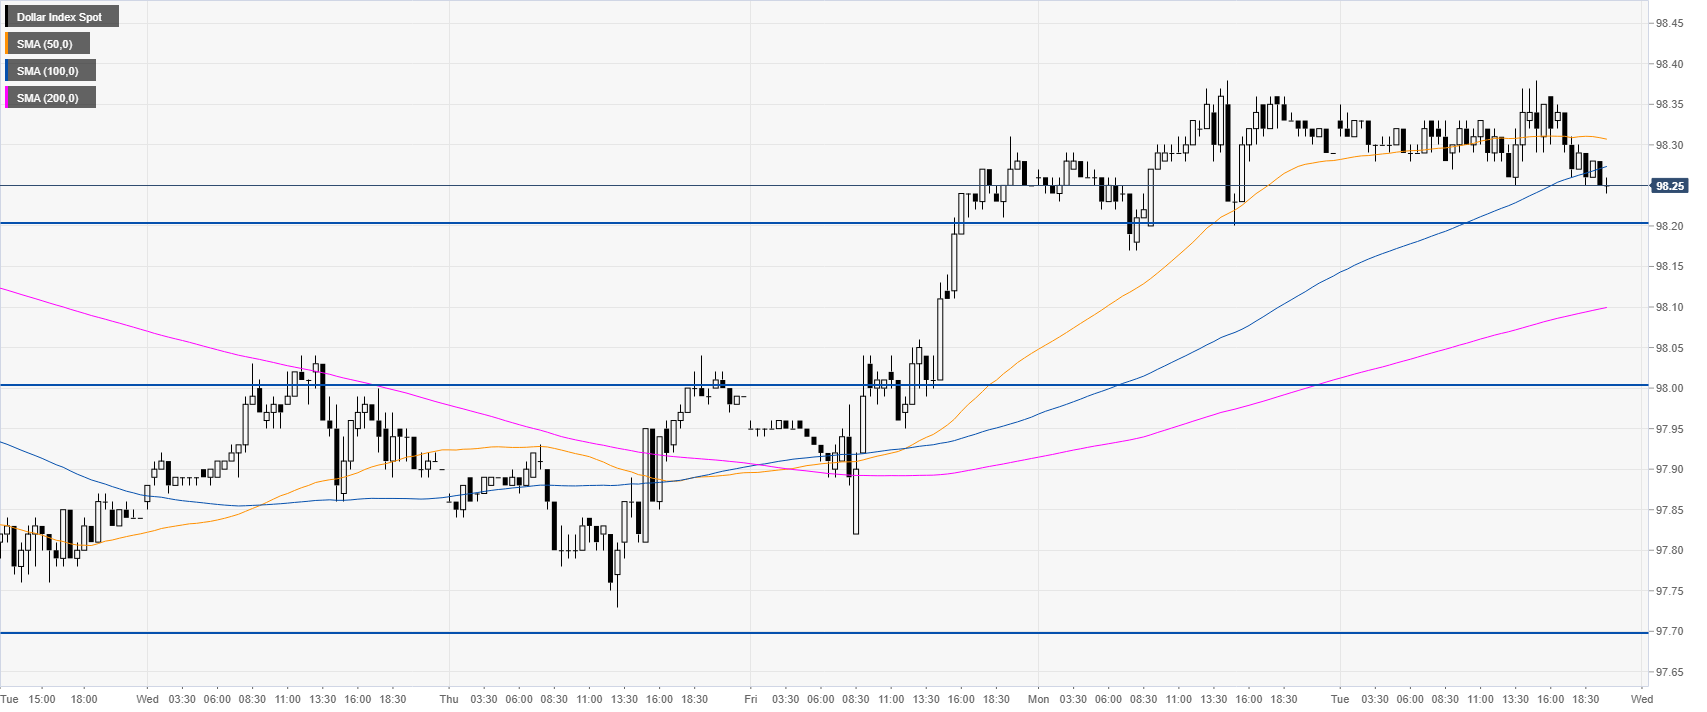
DXY 30-minute chart
The index is pulling back towards the 98.20 level while trading above an upward sloping 200 SMA. Further down, support is seen at the 98.00 handle.
Additional key levels
