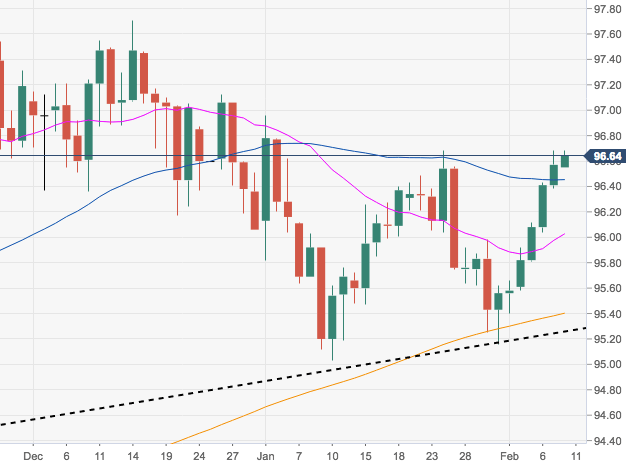
- Another day, another up move in DXY. The rally in the greenback remains well and sound and keeps the door open for another visit to YTD peaks in the 97.00 neighbourhood (January 2).
- Gains beyond this point are expected to meet 2018 highs around 97.70 recorded in mid-December.
- The constructive outlook on the buck should prevail as long as the 200-day SMA at 95.41 underpins. This significant area of support is also reinforced by a Fibo retracement of the September-December rally at 95.30 and recent lows at 95.16.
DXY daily chart
Dollar Index Spot
Overview:
Today Last Price: 96.63
Today Daily change: 13 pips
Today Daily change %: 0.06%
Today Daily Open: 96.57
Trends:
Daily SMA20: 96
Daily SMA50: 96.4
Daily SMA100: 96.21
Daily SMA200: 95.38
Levels:
Previous Daily High: 96.68
Previous Daily Low: 96.38
Previous Weekly High: 95.98
Previous Weekly Low: 95.16
Previous Monthly High: 96.96
Previous Monthly Low: 95.03
Daily Fibonacci 38.2%: 96.57
Daily Fibonacci 61.8%: 96.49
Daily Pivot Point S1: 96.41
Daily Pivot Point S2: 96.24
Daily Pivot Point S3: 96.11
Daily Pivot Point R1: 96.71
Daily Pivot Point R2: 96.84
Daily Pivot Point R3: 97.01
