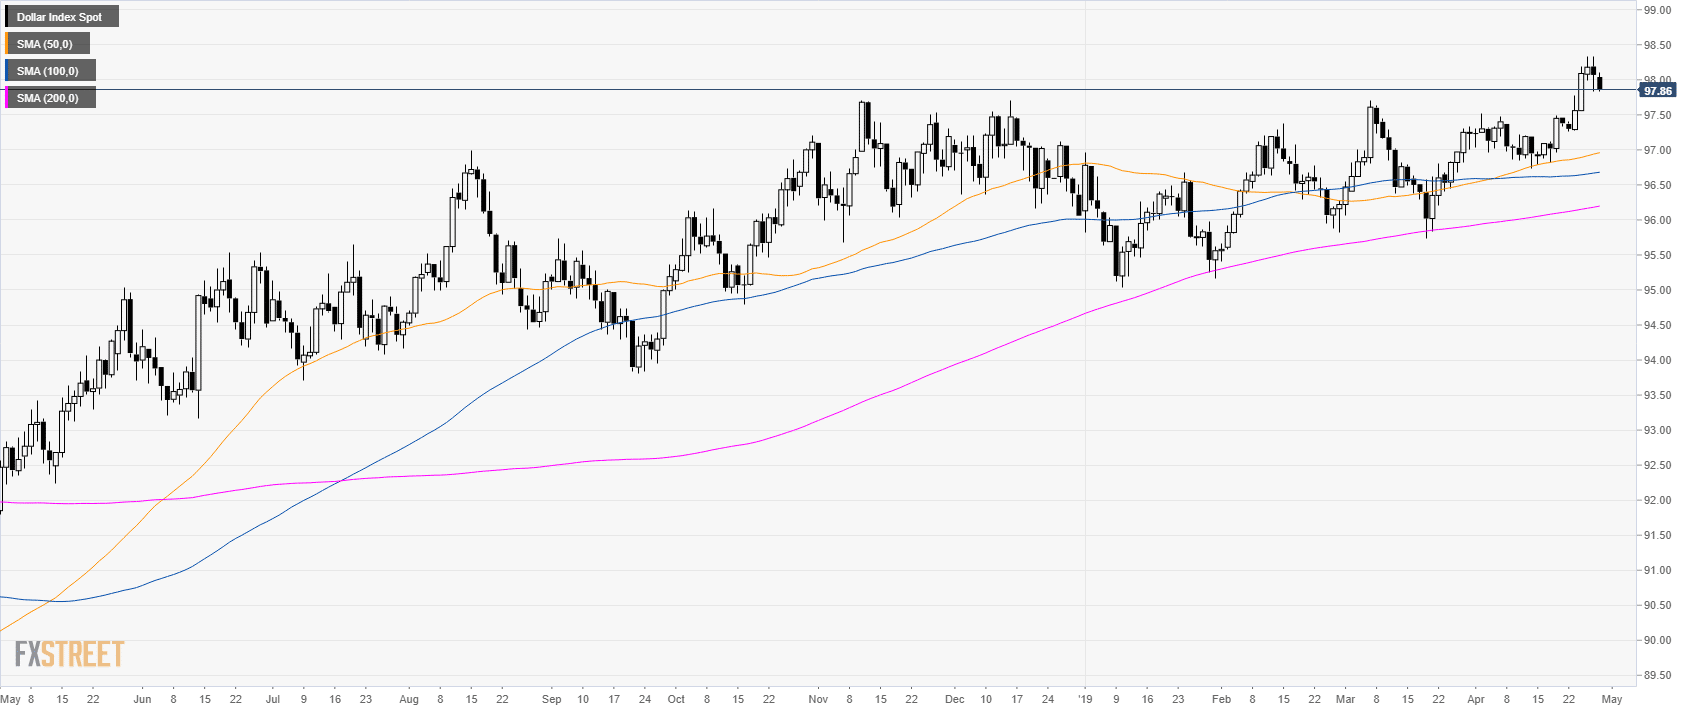
DXY daily chart
- The US Dollar Index (DXY) is trading in a bull trend above its main simple moving averages (SMAs).
- DXY is correcting down just below the 98.00 mark.
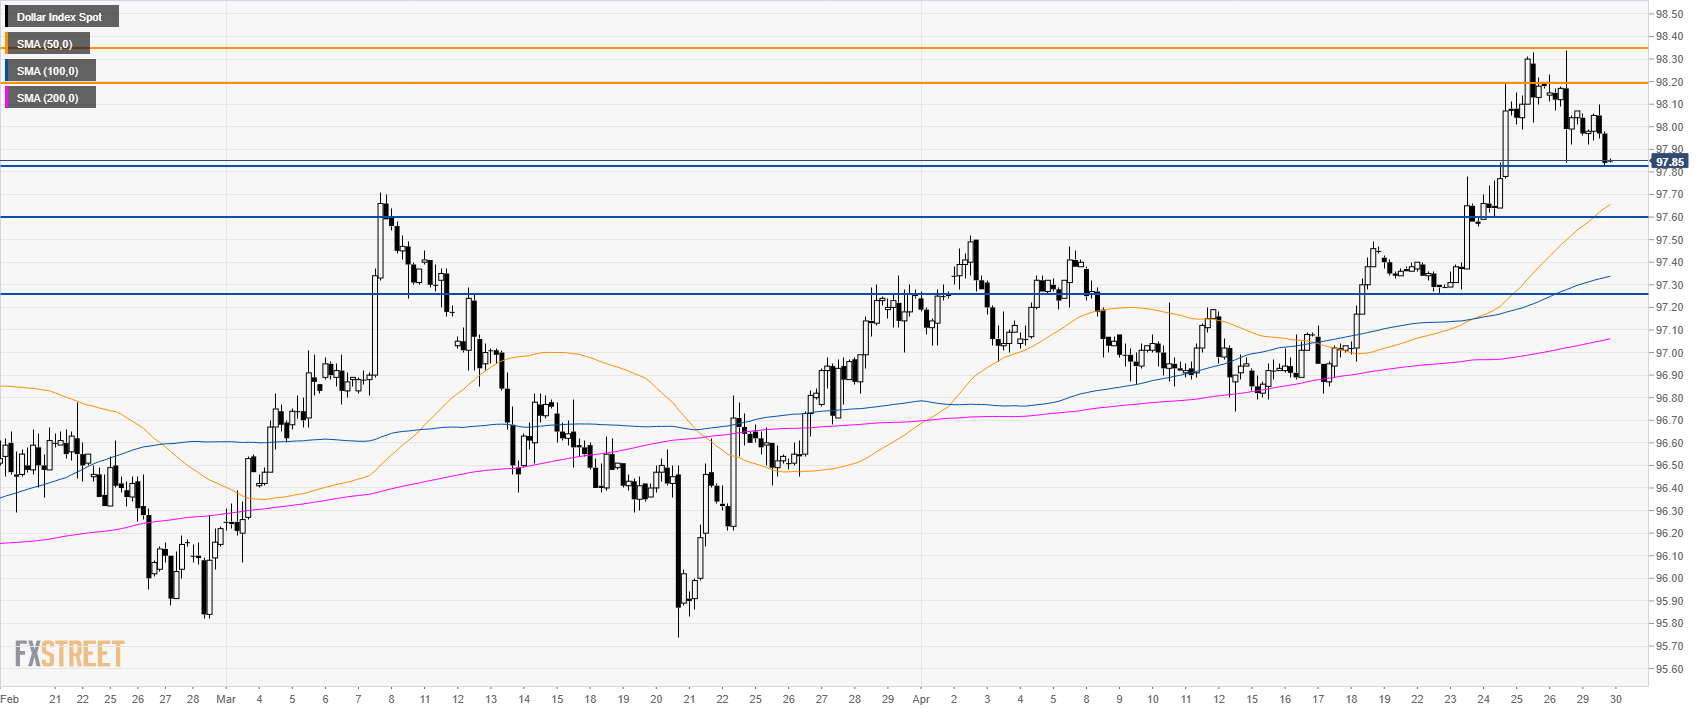
DXY 4-hour chart
- The momentum is bullish as the index trades above its main SMAs, however, a break below 97.80 can lead to a correction to 97.60 and 97.26 if bears gather enough steam.
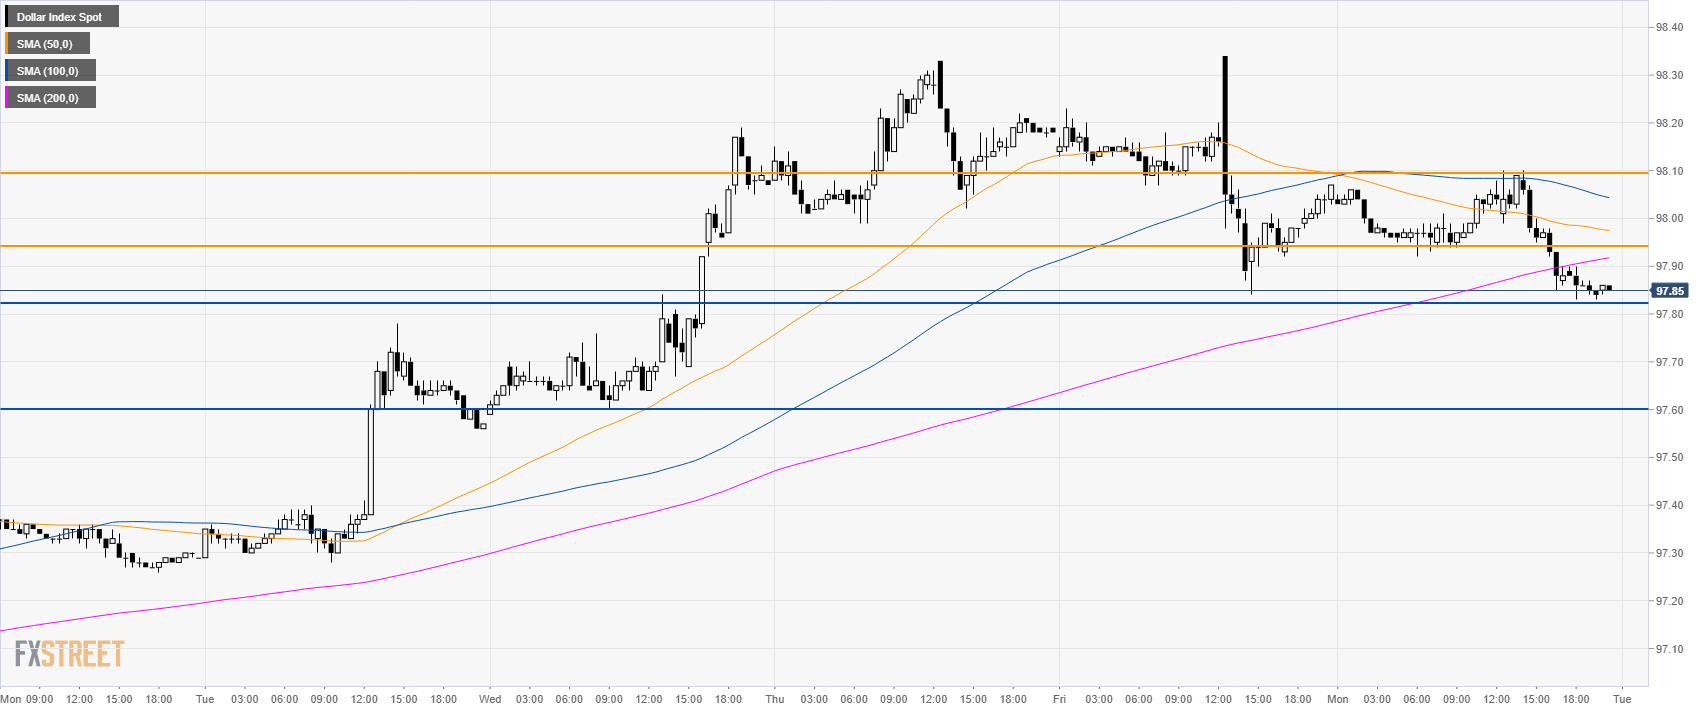
DXY 30-minute chart
- As DXY is trading below its main SMAs the market can continue to weaken.
- To the upside, resistances are seen at 97.95 and 98.10 level.
Additional key levels
