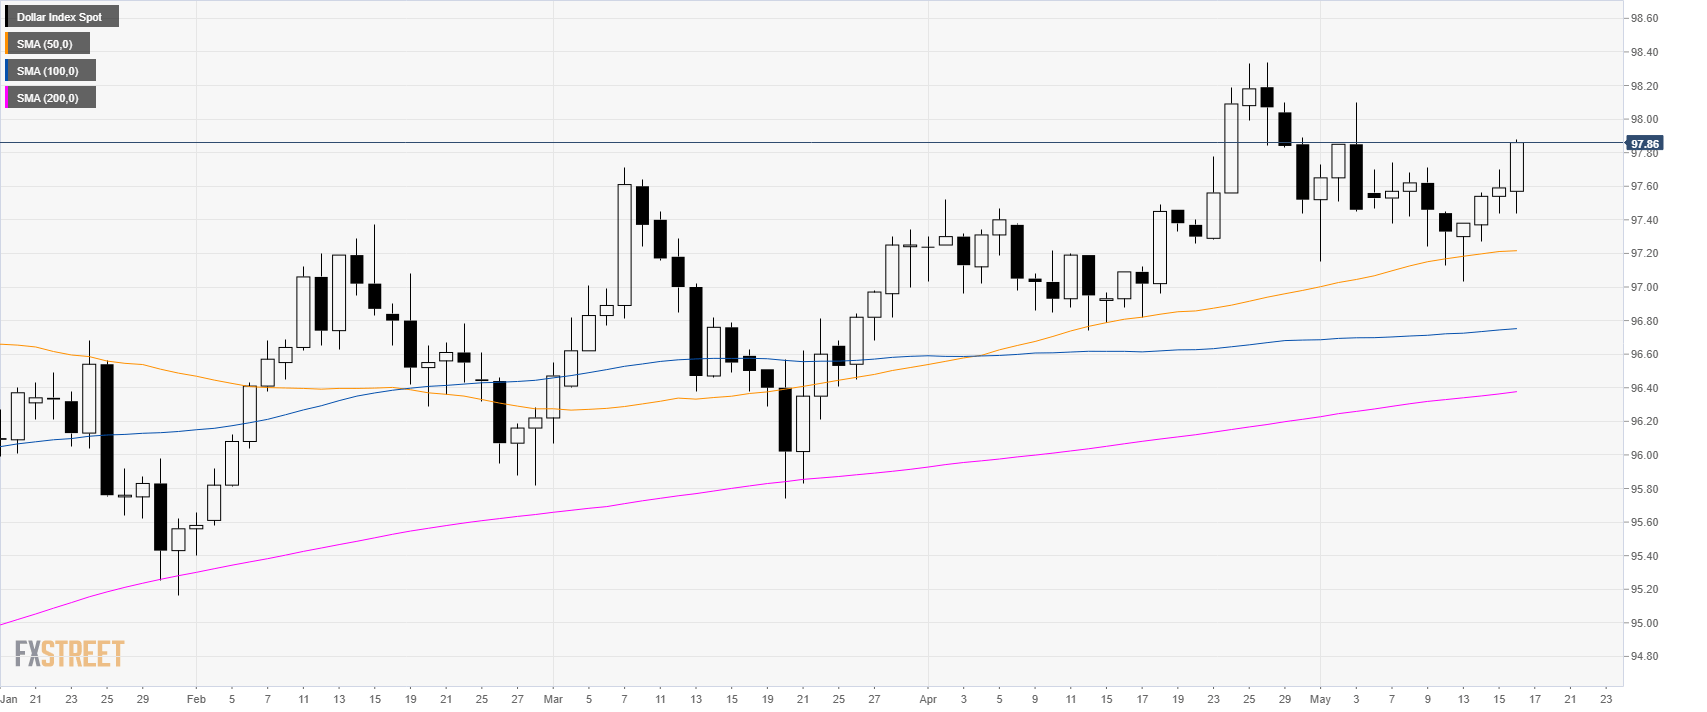
DXY daily chart
The US Dollar Index (DXY) is trading in a bull trend above its main simple moving averages (SMAs).
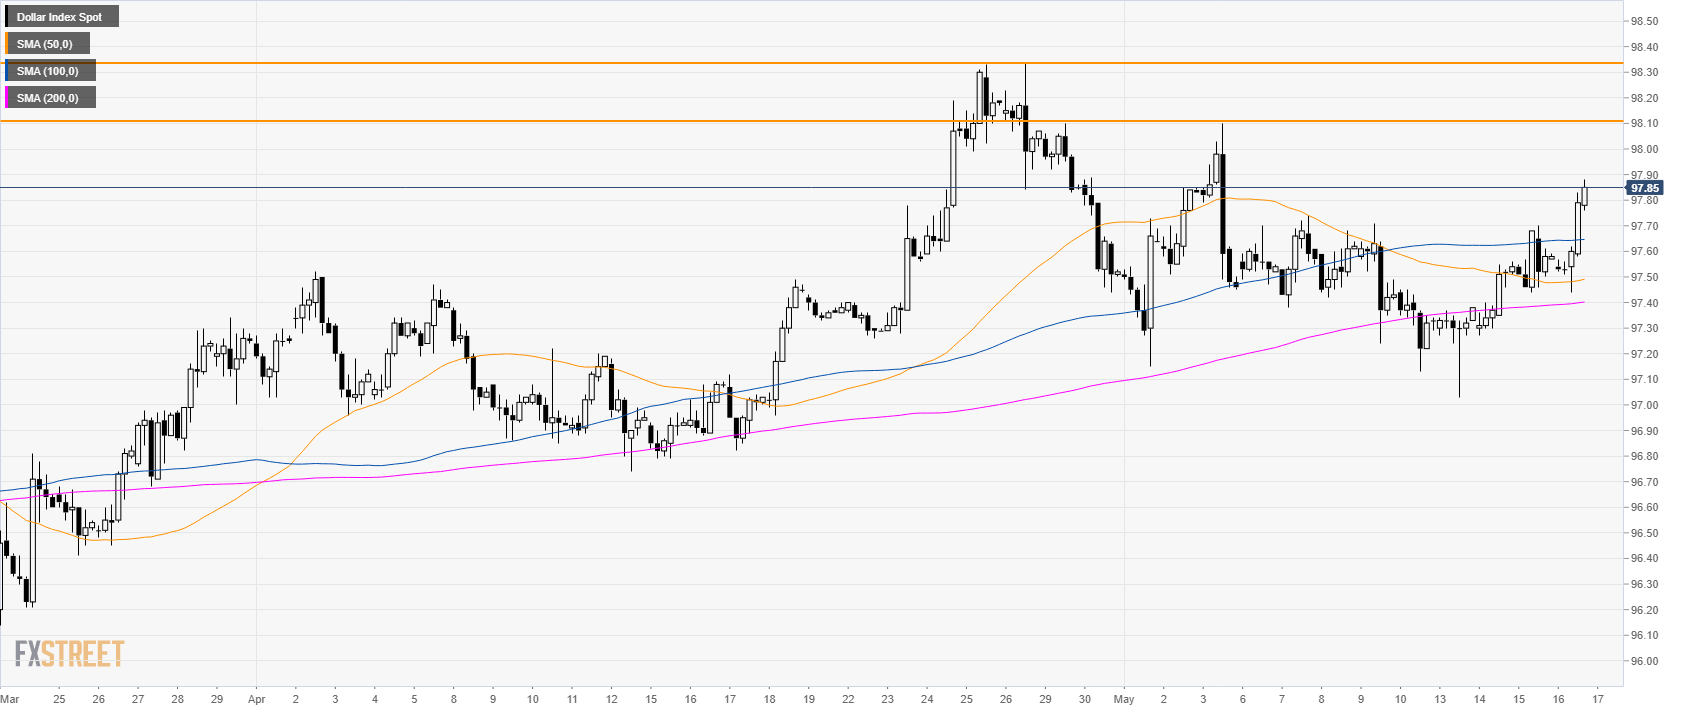
DXY 4-hour chart
The market is trading above its main SMAs suggesting bullish momentum in the near term. The 98.10 is most likely the next target to the upside. If the market has enough stamina DXY can reach the 2019 high at the 98.34 price level.
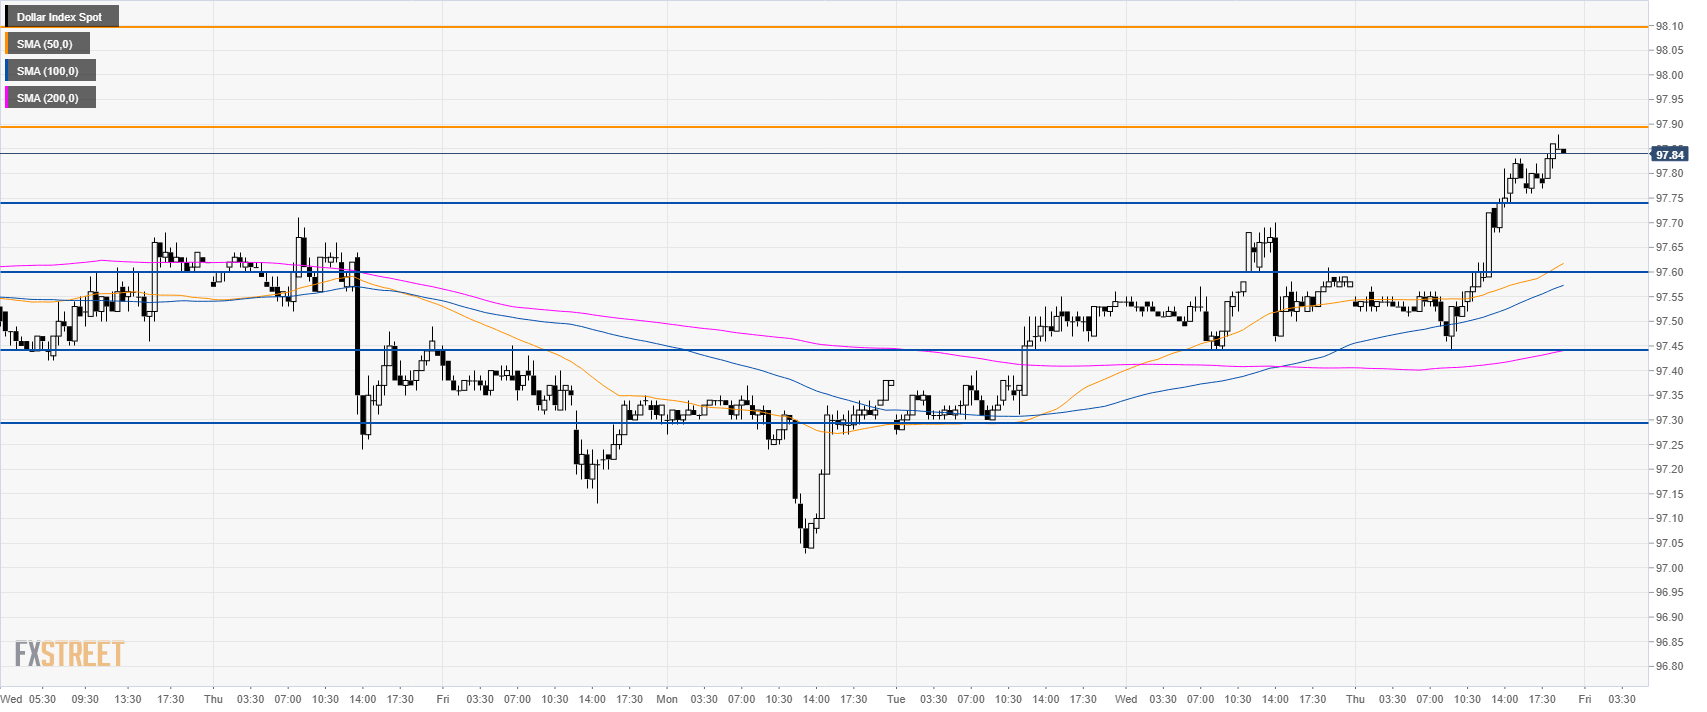
DXY 30-minute chart
DXY is trading above its main SMAs suggesting bullish momentum in the near term. Bulls will try to break 97.90 to reach 98.10 and 98.34 to the upside. Immediate support is seen at 97.74 and 97.60 price level.
Additional key levels
