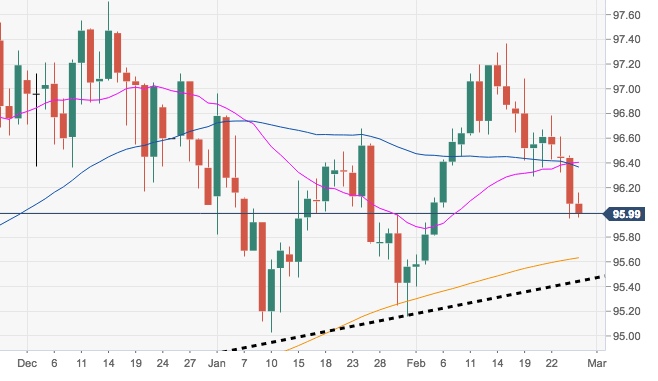
- The index is extending the pullback to fresh lows, briefly breaking below the key support at the 96.00 handle following Powell’s testimony on Tuesday.
- A potential visit to the critical 200-day SMA at 95.63 will be exposed in case the selling mood gathers pace.
- This important area of support is reinforced by the short-term support line, today at 95.44.
DXY daily chart
Dollar Index Spot
Overview:
Today Last Price: 96.01
Today Daily change: 20 pips
Today Daily change %: -0.06%
Today Daily Open: 96.07
Trends:
Daily SMA20: 96.43
Daily SMA50: 96.31
Daily SMA100: 96.43
Daily SMA200: 95.62
Levels:
Previous Daily High: 96.46
Previous Daily Low: 95.95
Previous Weekly High: 97.08
Previous Weekly Low: 96.29
Previous Monthly High: 96.96
Previous Monthly Low: 95.03
Daily Fibonacci 38.2%: 96.14
Daily Fibonacci 61.8%: 96.27
Daily Pivot Point S1: 95.86
Daily Pivot Point S2: 95.65
Daily Pivot Point S3: 95.35
Daily Pivot Point R1: 96.37
Daily Pivot Point R2: 96.67
Daily Pivot Point R3: 96.88
