- The Greenback is losing steam ahead of the FOMC at 18:00 GMT.
- The level to beat for sellers is the 98.20 support.
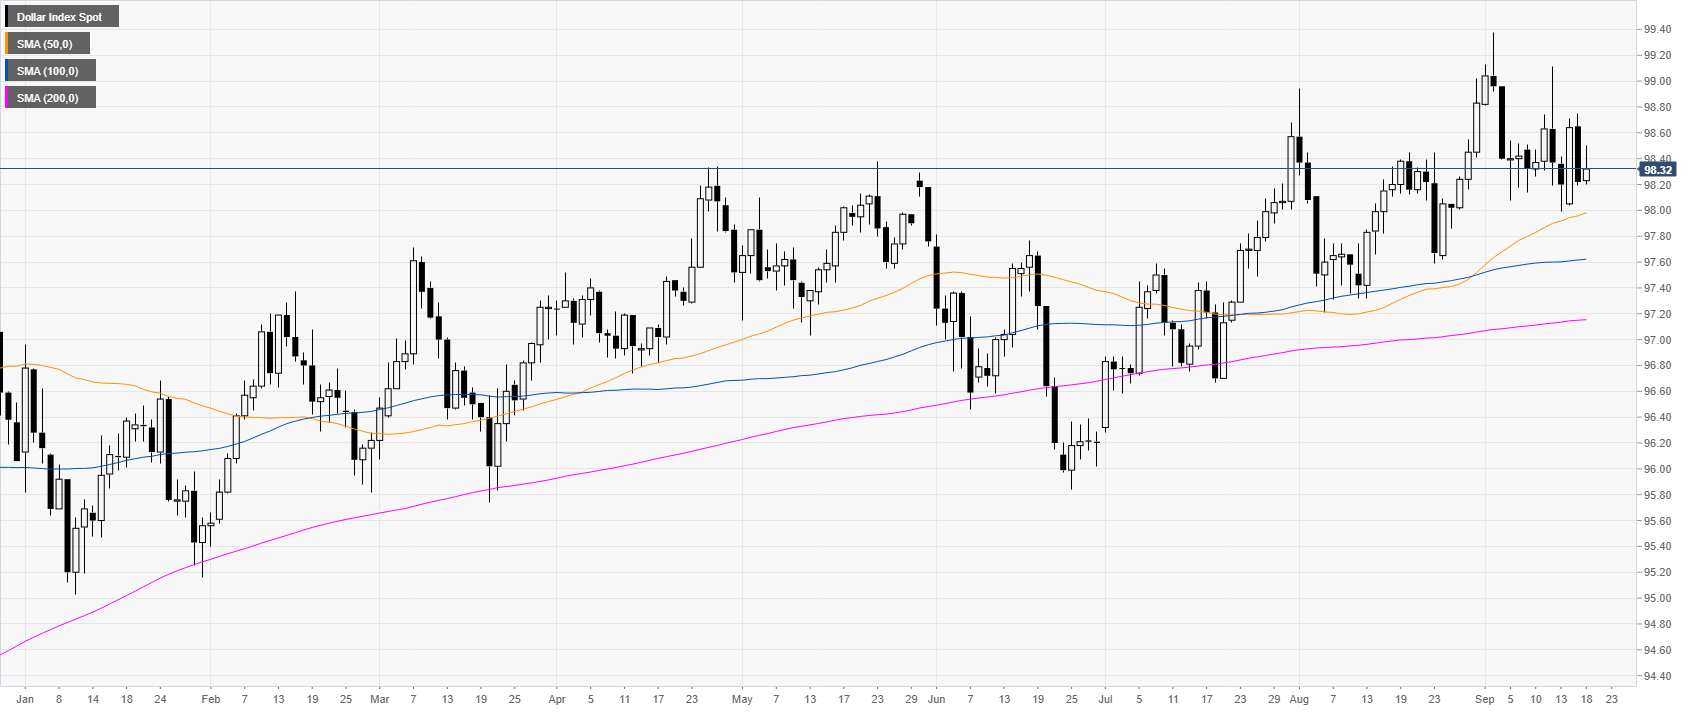
DXY daily chart
DXY (US Dollar Index) is trading in a bull trend above the main daily simple moving averages (DSMAs). The Greenback has been trading in a range in the last two weeks. Traders will be watching the FOMC closely for fresh directional clues. The market has already priced in a 25 bps rate cut.
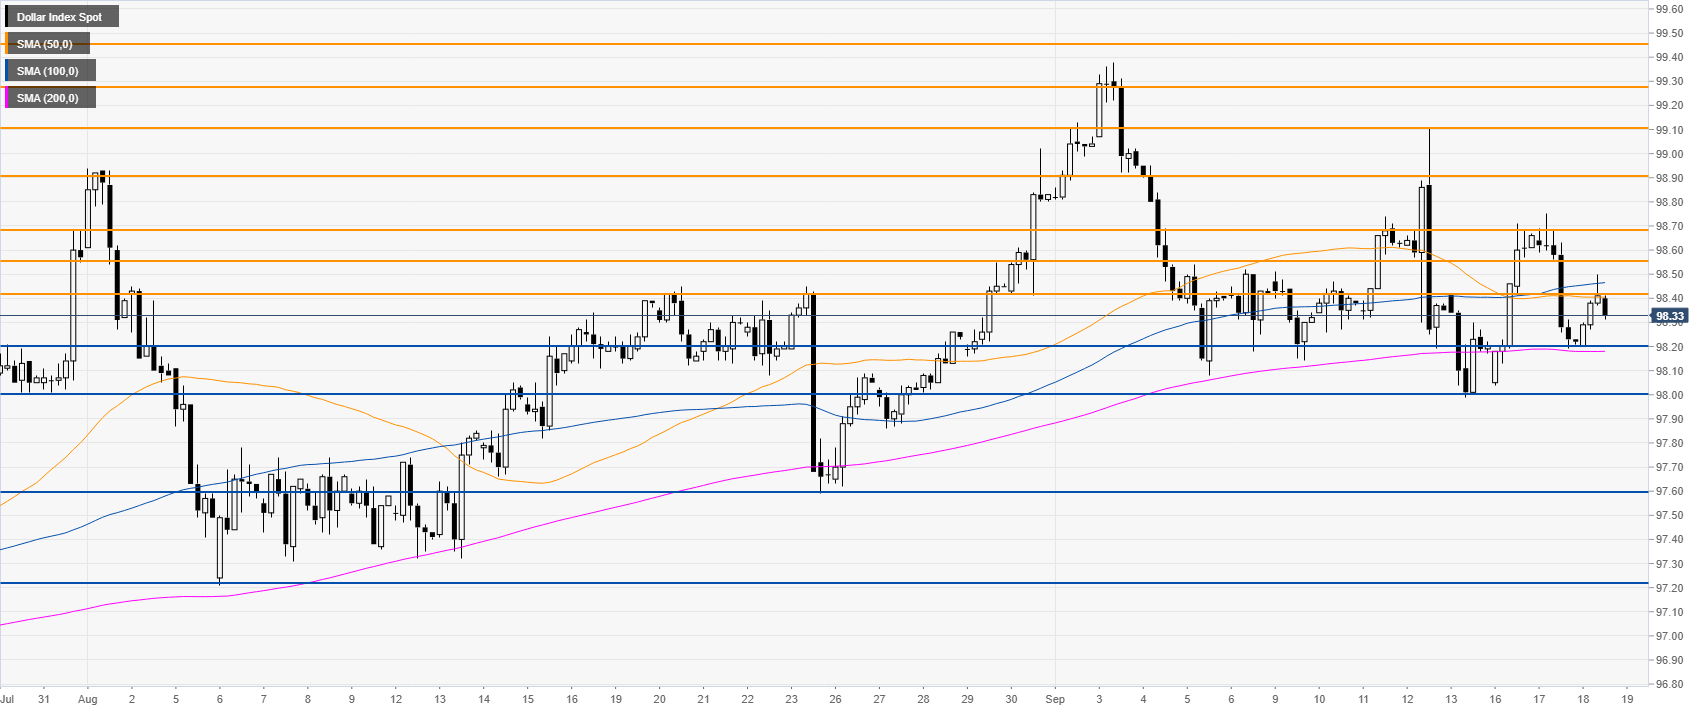
DXY four-hour chart
DXY is trading below the 50/100 SMAs, suggesting a consolidation in the medium term. If sellers overcome the 98.20 support, the market can decline towards the 97.60 and 97.20 swing lows.
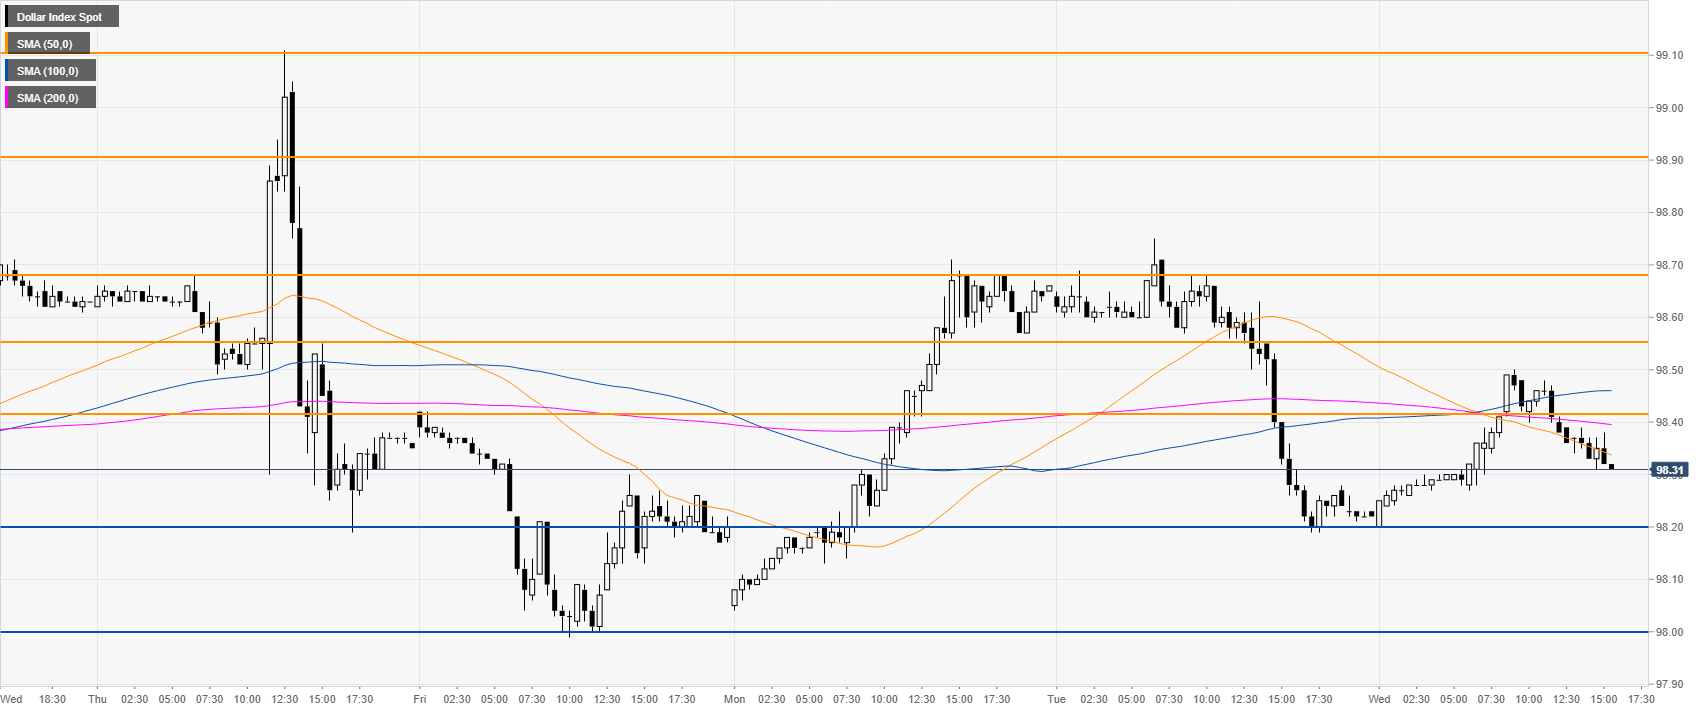
DXY 30-minute chart
DXY is trading below the main SMAs, suggesting a bearish bias in the near term. Immediate resistances are at the 98.42 and 98.55 price levels.
Additional key levels
