- The risk-off mood is helping the US Dollar to climb back near the 98.00 level.
- The next resistance can be 98.10 followed by the 2019 high at 98.38.
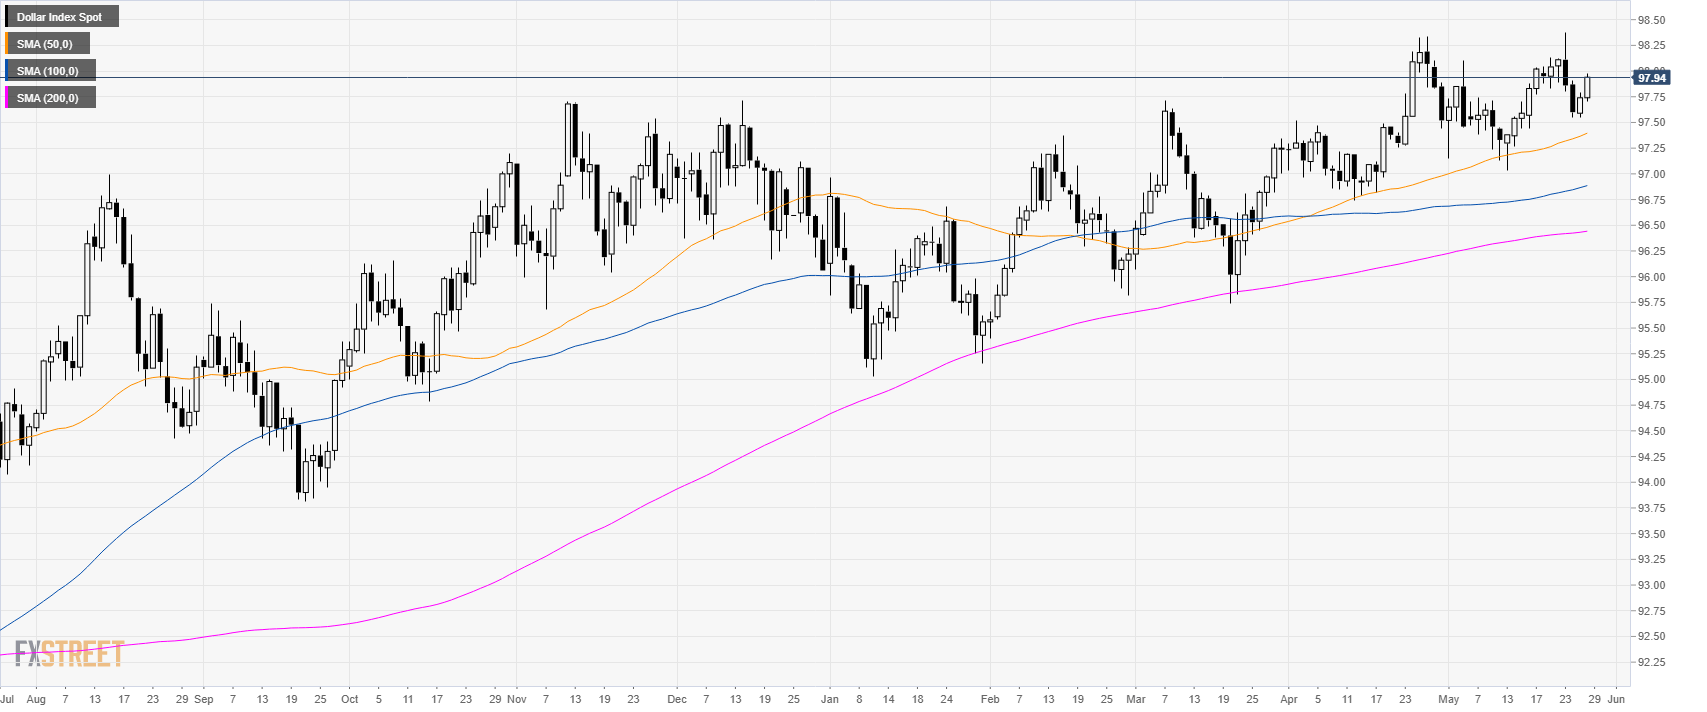
DXY daily chart
The US Dollar Index (DXY) is in a bull trend above its main simple moving averages (SMAs). DXY is regaining some of the lost ground last week.
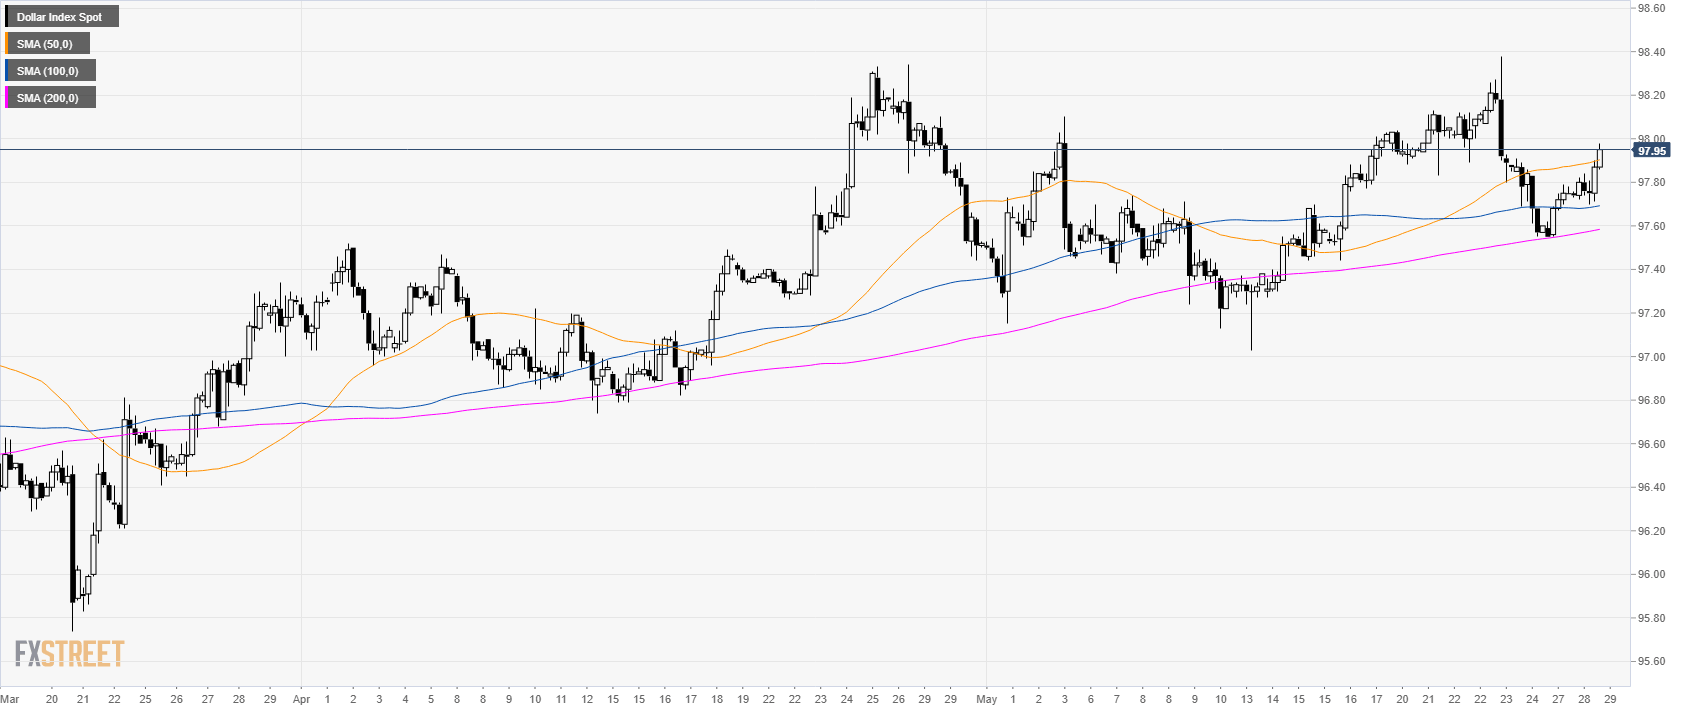
DXY 4-hour chart
The greenback is trading above its main SMAs suggesting bullish momentum in the medium term.
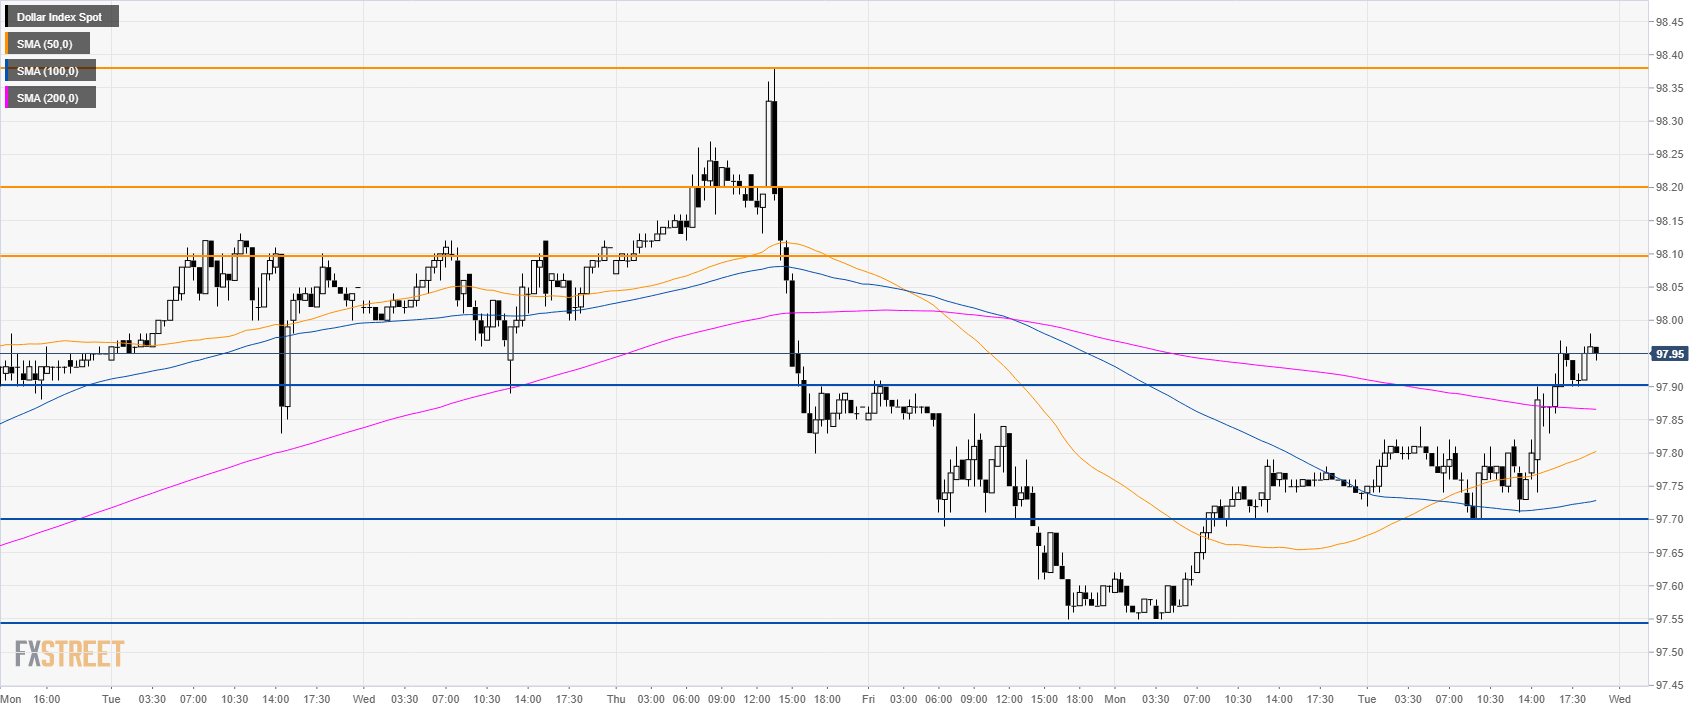
DXY 30-minute chart
DXY is trading above the 97.90 resistance and its main SMAs suggesting that bulls can try to drive the market towards 98.10/20 and 98.38 the 2019 high. On the flip side, if bears bring the market below 97.90 then a retracement towards 97.70 can be on the cards.
Additional key levels
