- The Greenback is trading in the 99.63/99.00 band for the third consecutive day.
- The level to beat for bulls is the 99.00/99.10 resistance zone.
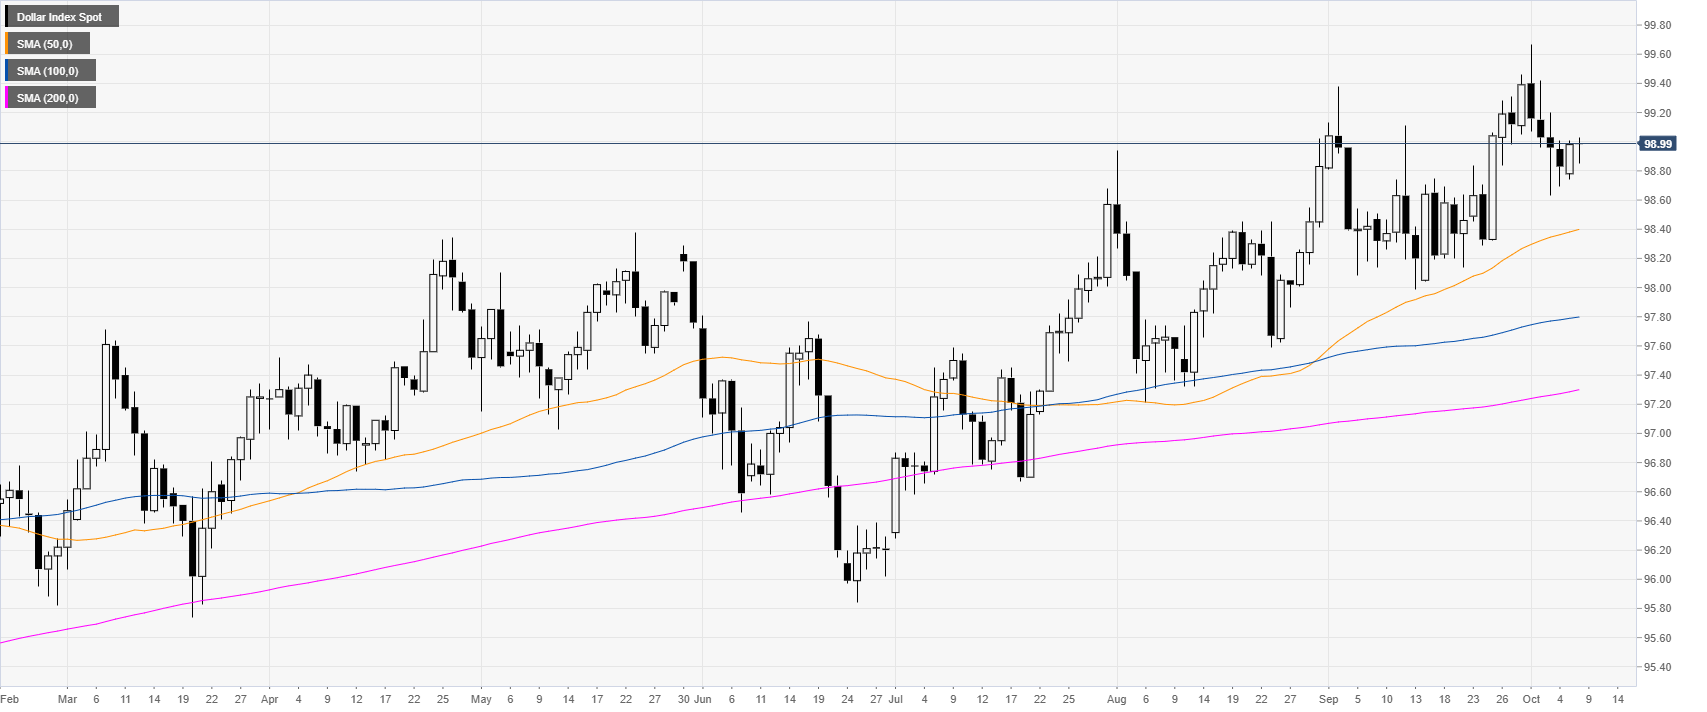
DXY daily chart
The US Dollar Index (DXY) is trading in an uptrend above its main daily simple moving averages (DSMAs).
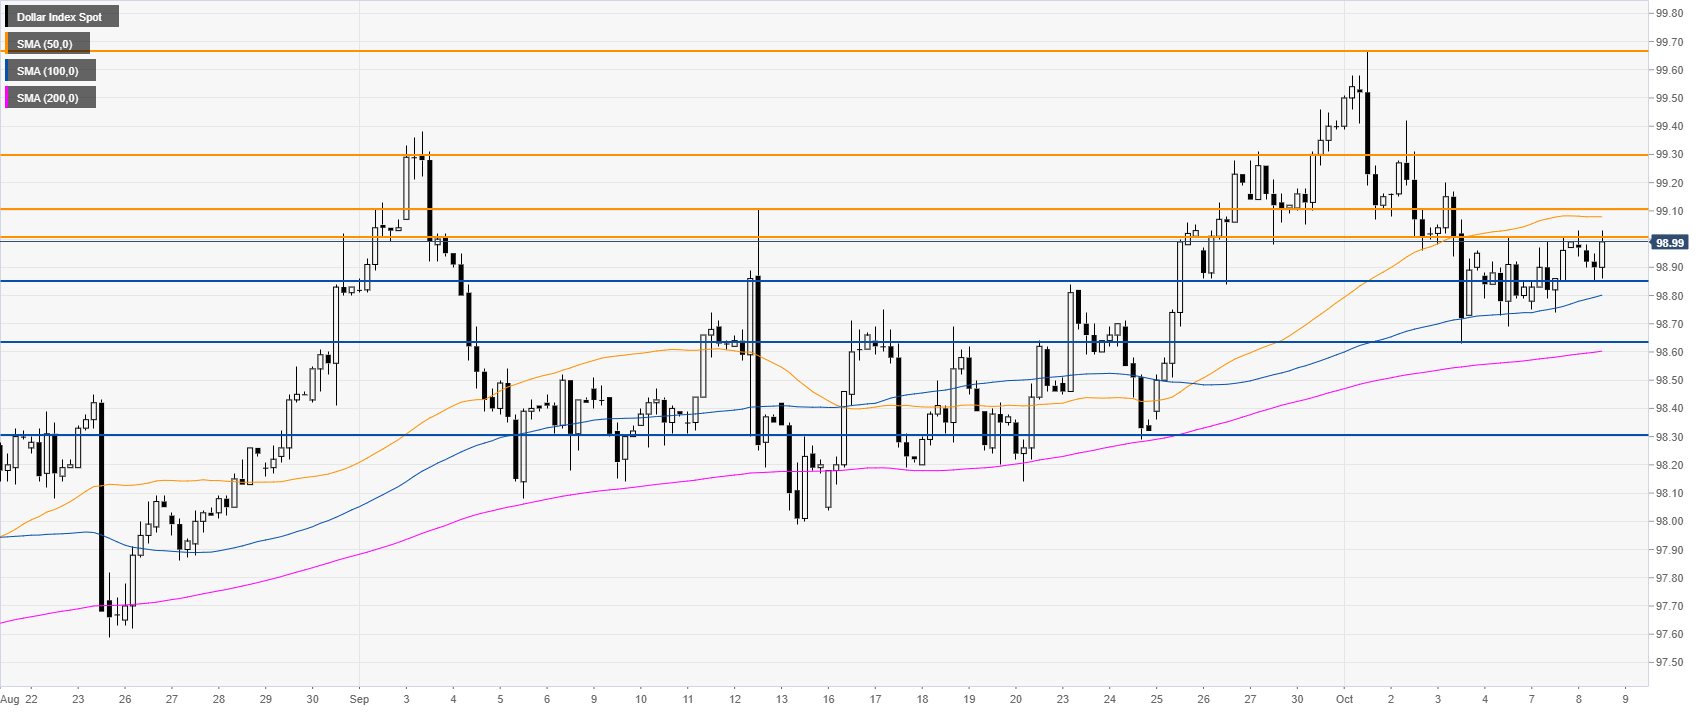
DXY four-hour chart
DXY is in the 98.63/99.00 range while trading between the 50 and 100 SMAs. The Greenback is bullish above the 200 SMA and a break of the 99.00/99.10 resistance zone can expose the 99.30 resistance in the medium term.
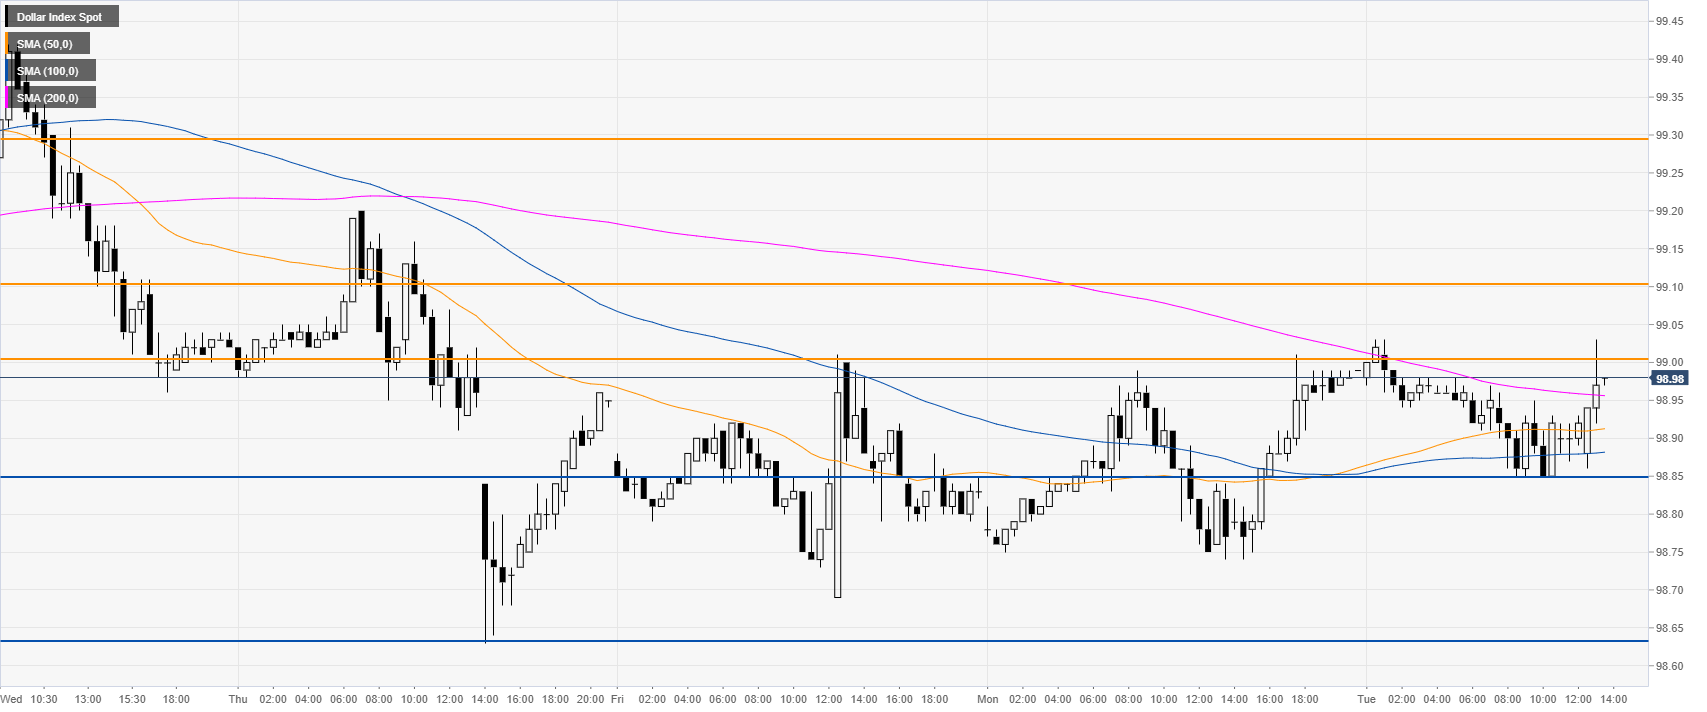
DXY 30-minute chart
DXY is trading above its main SMAs, suggesting bullish momentum in the short term. Support is seen at the 98.85 and 98.63 price levels.
Additional key levels
