- DXY (US Dollar Index) is breaking above the 2019 high as the market is trading at its highest since May 2017.
- The next key resistance can be seen at the 99.27 level.
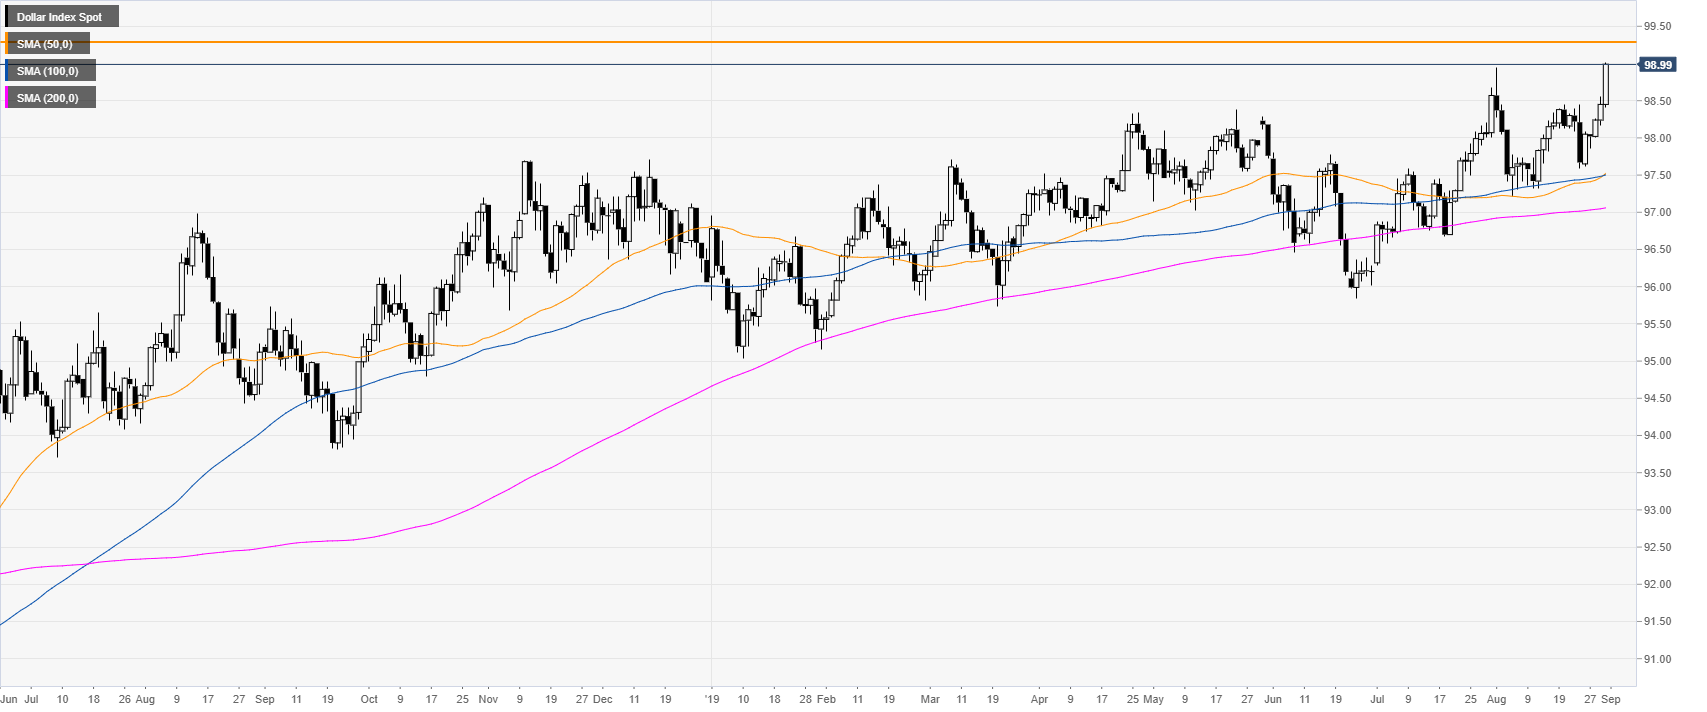
DXY daily chart
DXY (US Dollar Index) is trading in a bull trend above the main daily simple moving averages (DSMAs) as the market is trading at is highest since May 2017.
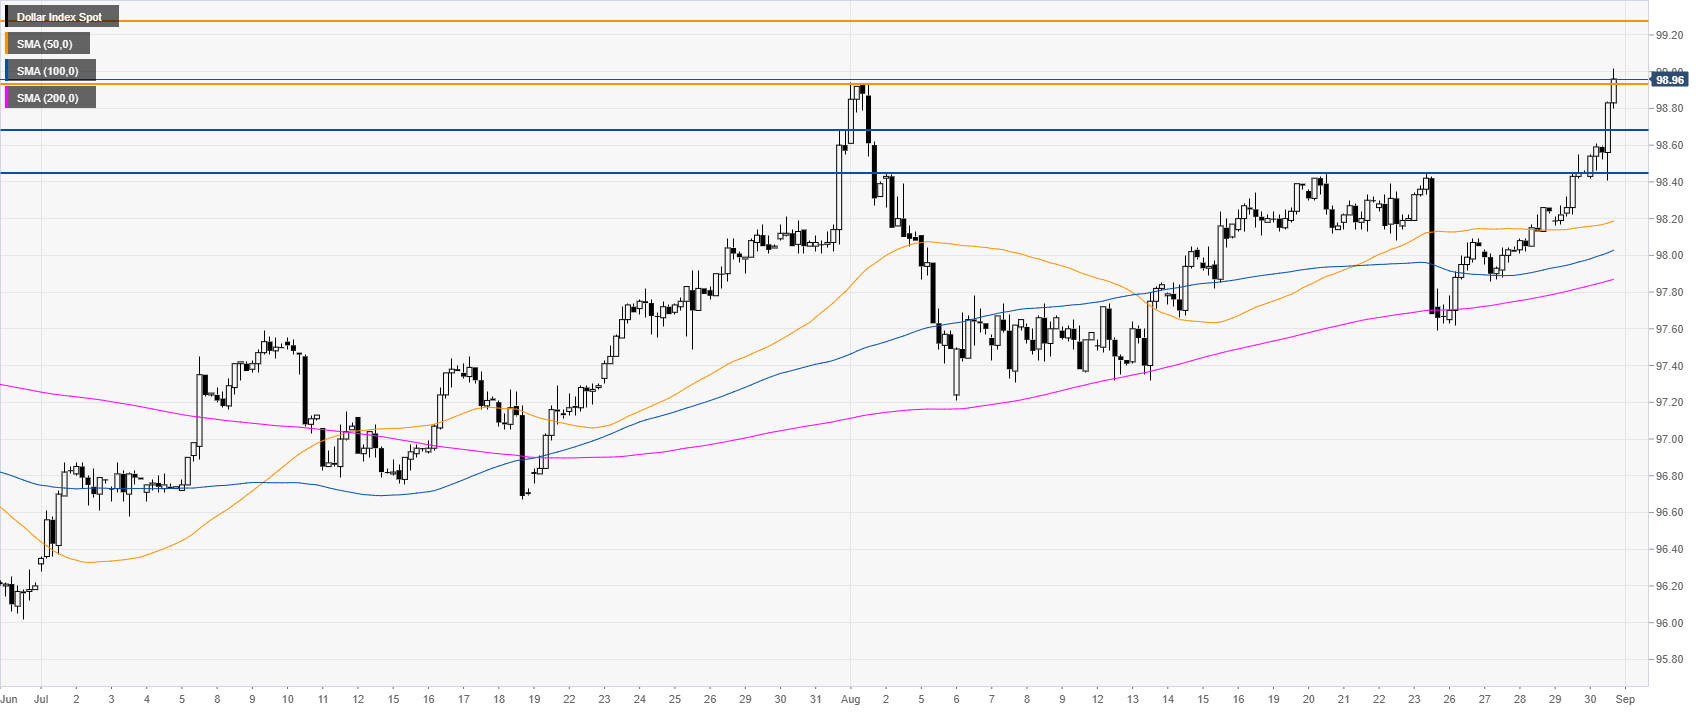
DXY 4-hour chart
DXY broke above 98.94 resistance, the previous 2019 high, opening the gates for a potential continuation up towards 99.27, previous key level. If the market holds above the 98.94 level, it would be seen as a bullish sign.
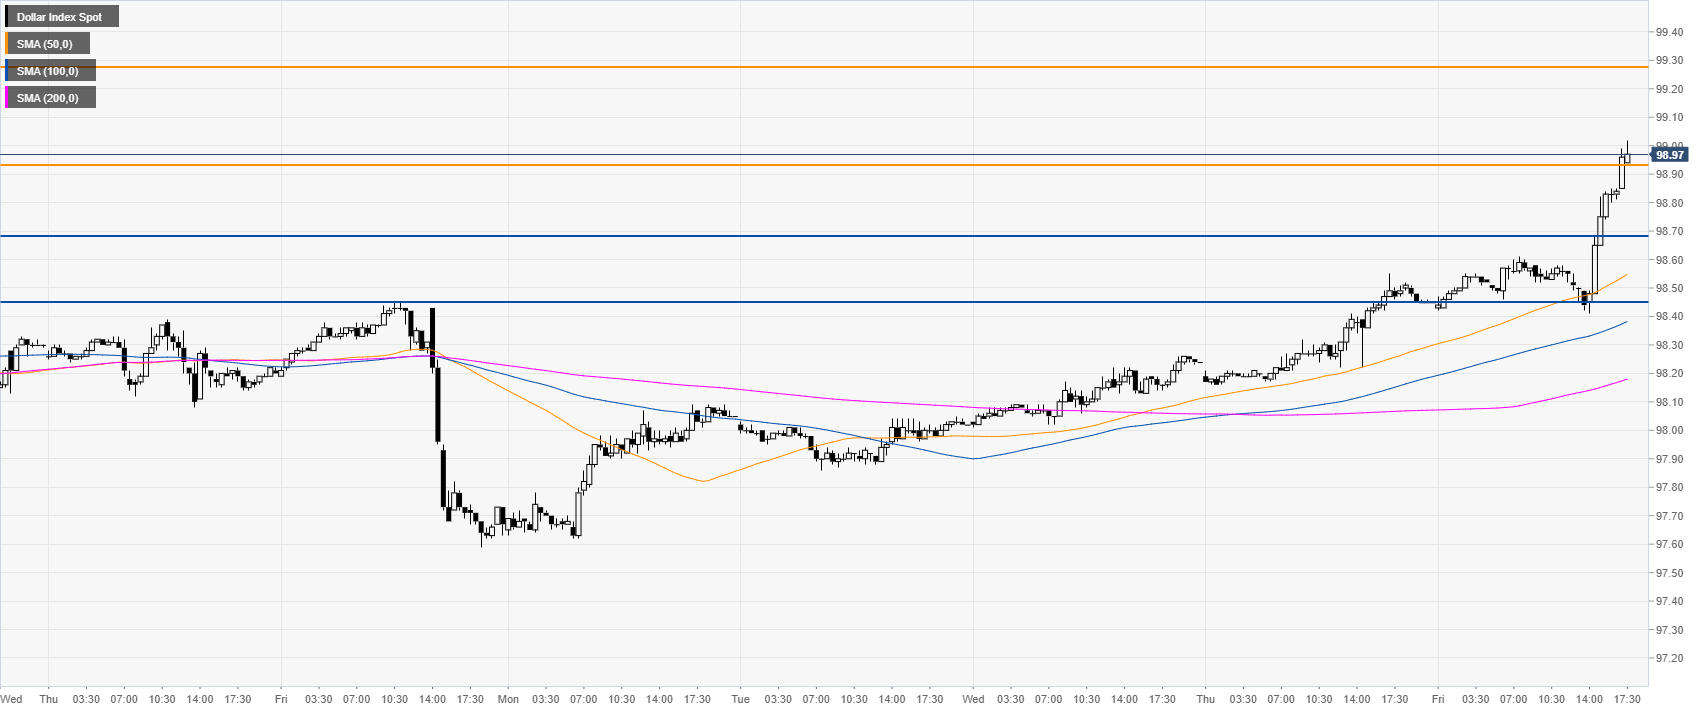
DXY 30-minute chart
DXY is trading above the main SMAs, suggesting bullish momentum in the short term. Immediate support is seen at the 98.94 and the 98.68 levels.
Additional key levels
