- DXY break to a new 2019 high as the Federal Reserve cuts interest rates.
- The level to beat for buyers are seen at 98.68, 99.00 and the 99.40 level.
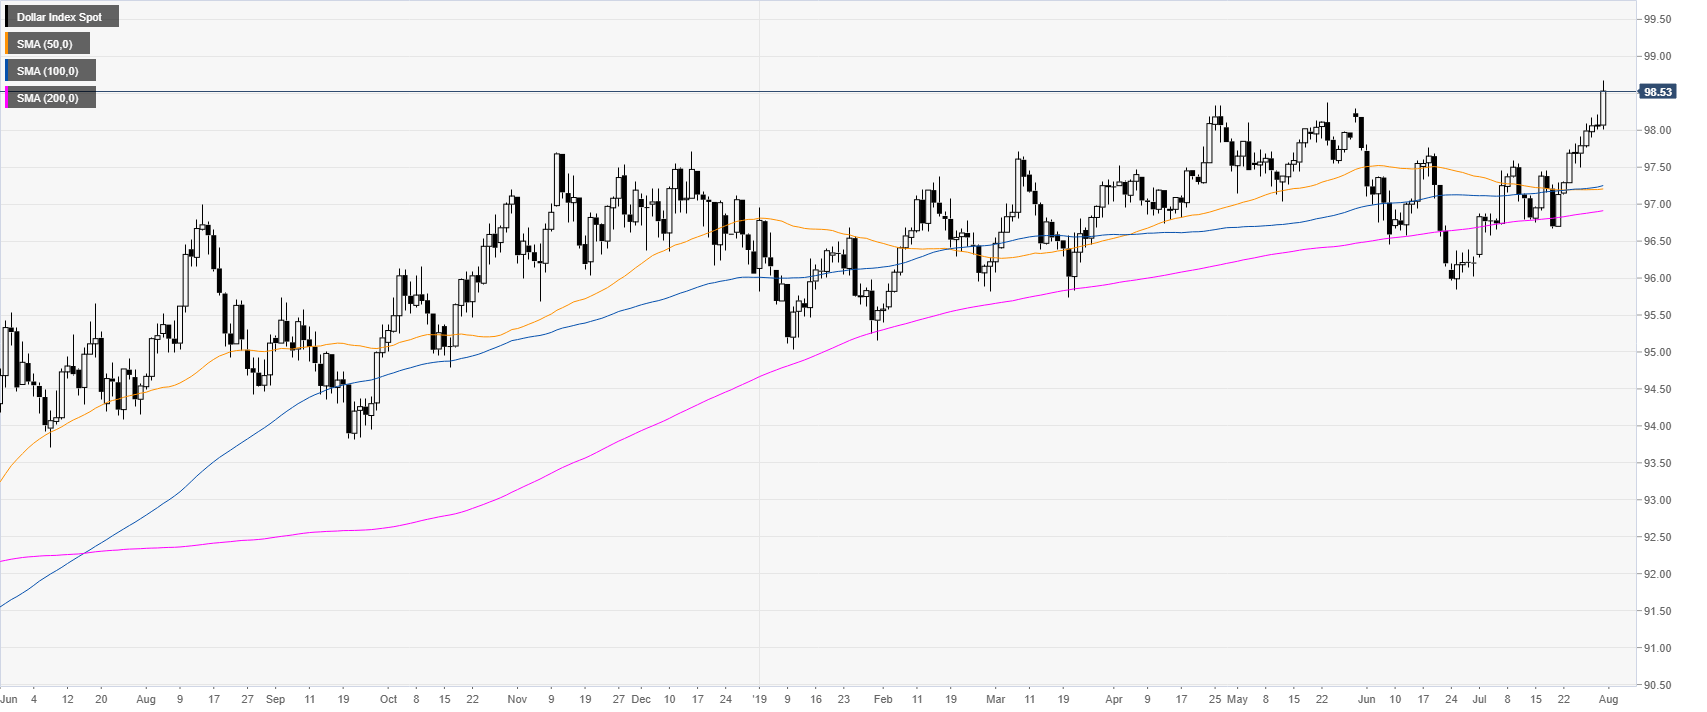
DXY daily chart
DXY (US Dollar Index) is trading in a bull trend above its main daily simple moving averages (DSMAs). DXY rose as the Federal Reserve cut interest rates as expected by 25 bps.
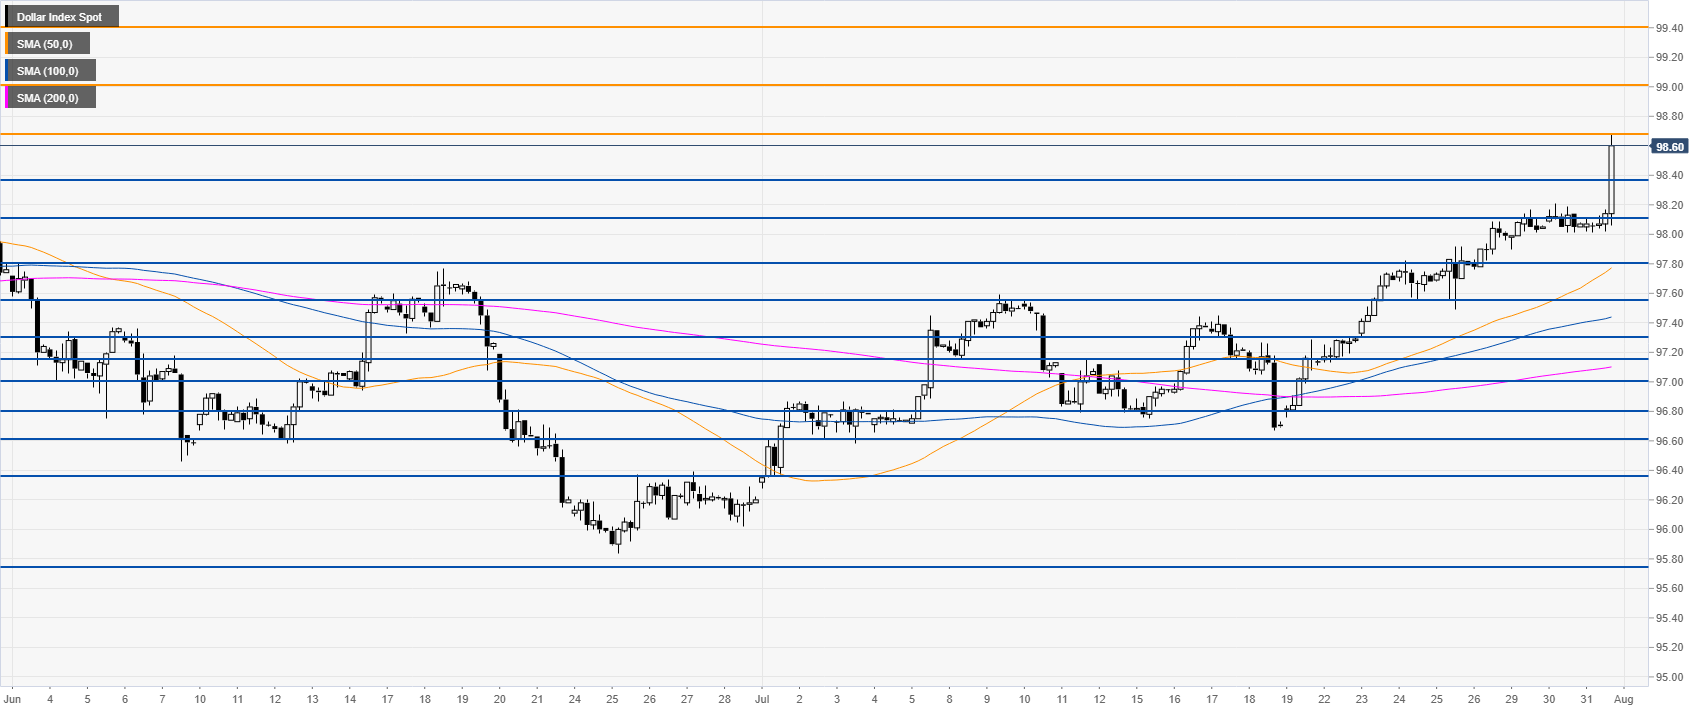
DXY 4-hour chart
DXY is trading above its main SMAs, suggesting bullish momentum in the medium term. The level to beat for bulls is 98.68, the new 2019 high established this Wednesday. A break above the level can open the doors to 99.00 and 99.40 to the upside.
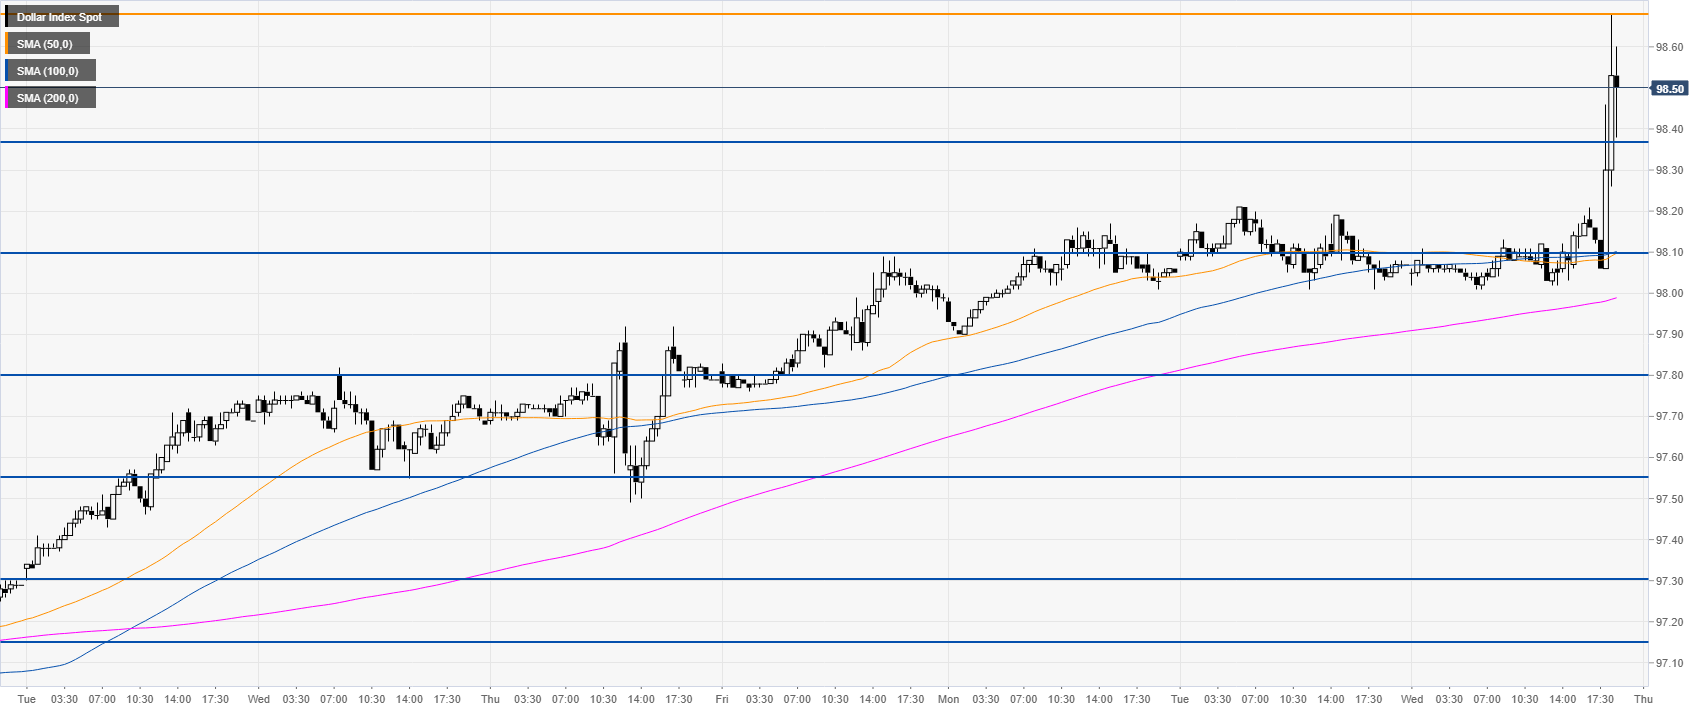
DXY 30-minute chart
DXY is trading above its main SMAs, suggesting bullish momentum in the near term. Immediate support can be seen at 98.38 and 98.10
Additional key levels
