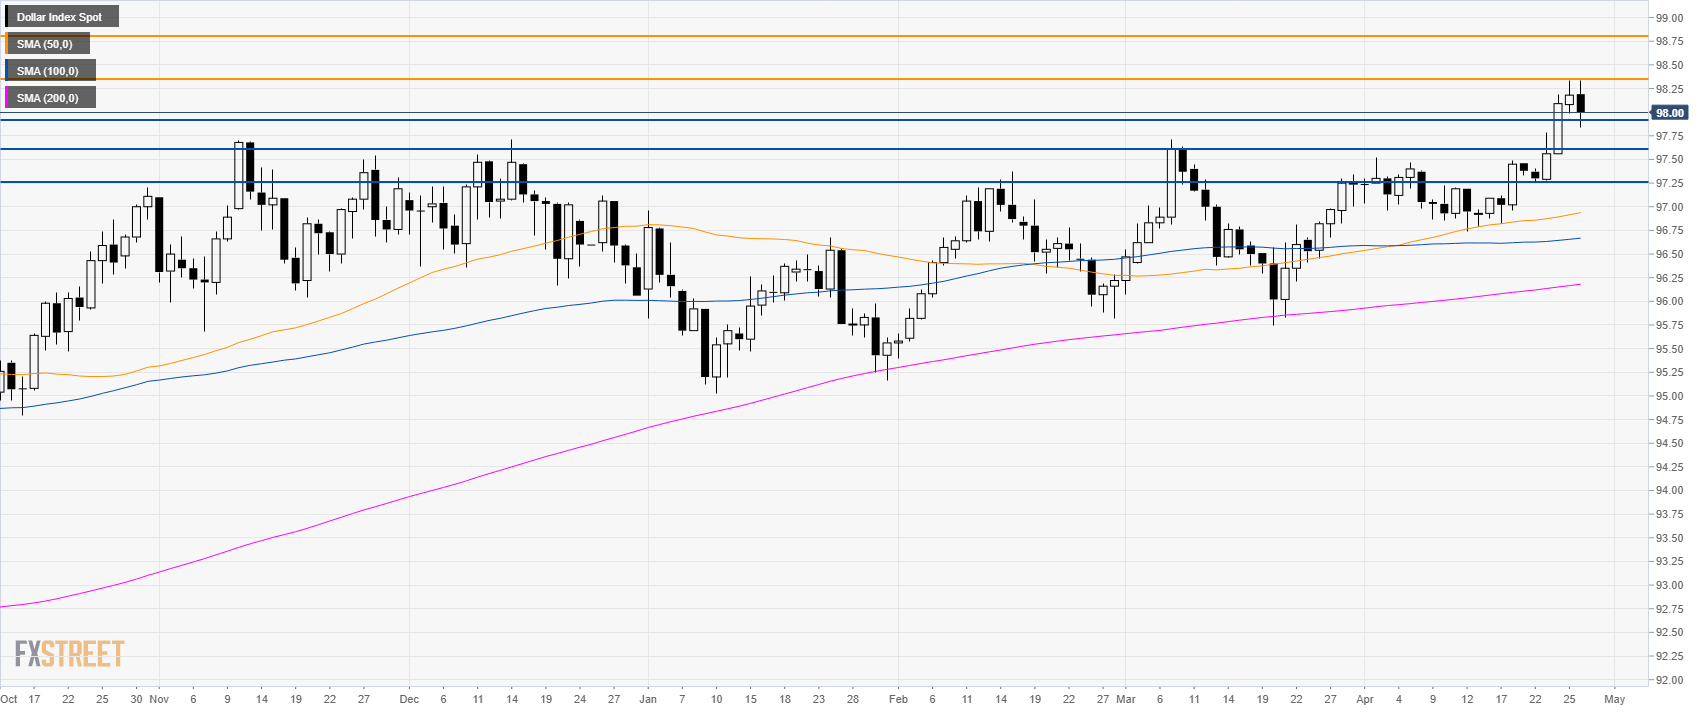
Home US Dollar Index Technical Analysis: DXY retraces down after US GDP readings
FXStreet News

US Dollar Index Technical Analysis: DXY retraces down after US GDP readings

DXY daily chart


  • The US Dollar Index (DXY) is trading in a bull trend above its main simple moving average (SMAs).
  • DXY found resistance at the 98.34 level after the release of the US GDP (Gross Domestic Product) Q1.
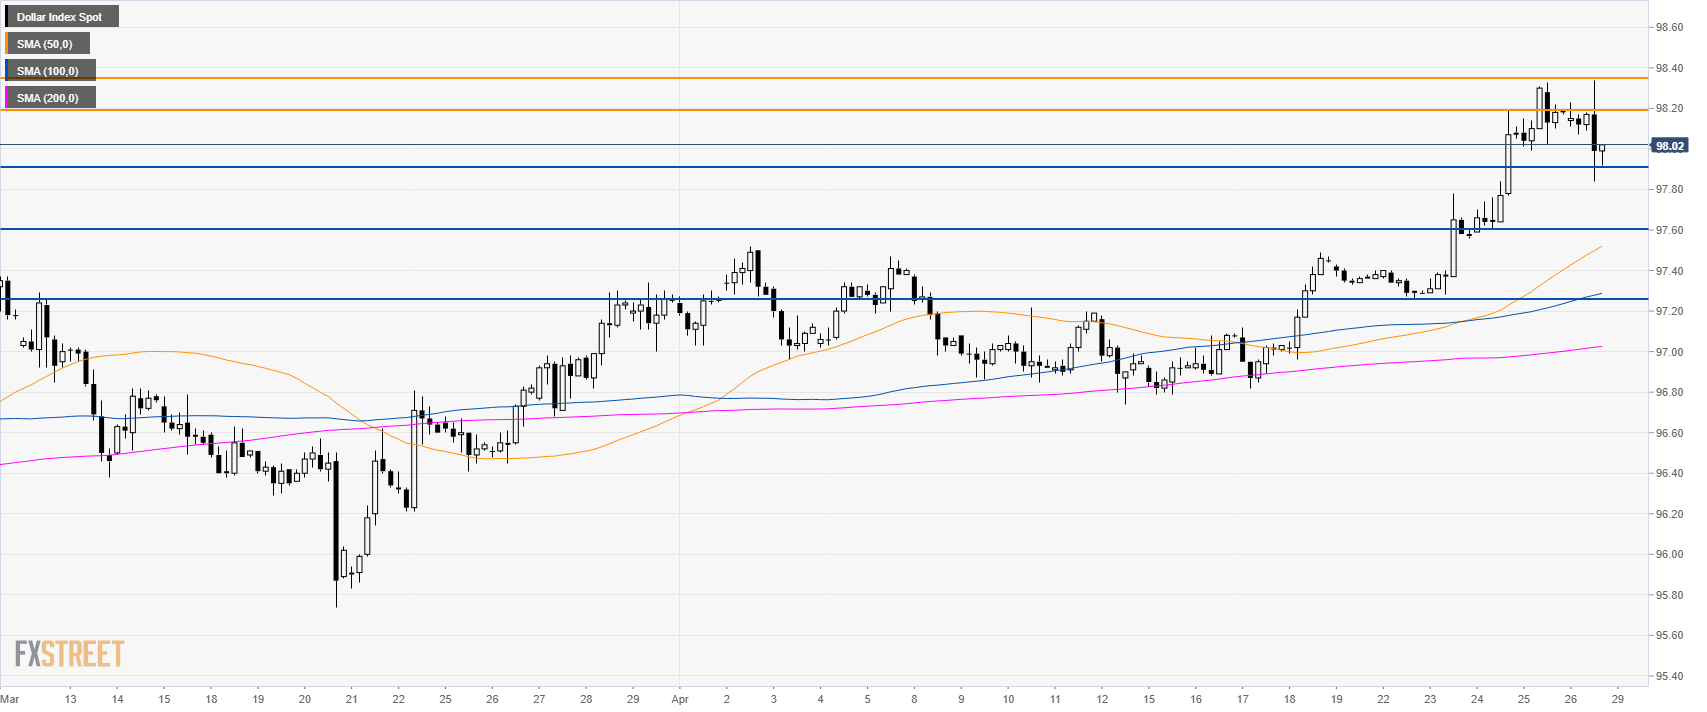
DXY 4-hour chart


  • The momentum is bullish as the index trades above its main SMAs, however a correction down can be on the cards.
  • A break below 97.90 can lead to 97.60 and 97.26 if bears gather enough steam.
  • Resistance is at 98.20 and 98.34 level.


Additional key levels


FX Street

FX Street

FXStreet is the leading independent portal dedicated to the Foreign Exchange (Forex) market. It was launched in 2000 and the portal has always been proud of their unyielding commitment to provide objective and unbiased information, to enable their users to take better and more confident decisions.