- DXY is under bearish pressure as the market is challenging last week’s lows.
- Investors are likely watching the 98.20/98.00 support zone.
- On Wednesday, traders will monitor the Retail Sales Control Group in the United States (US).
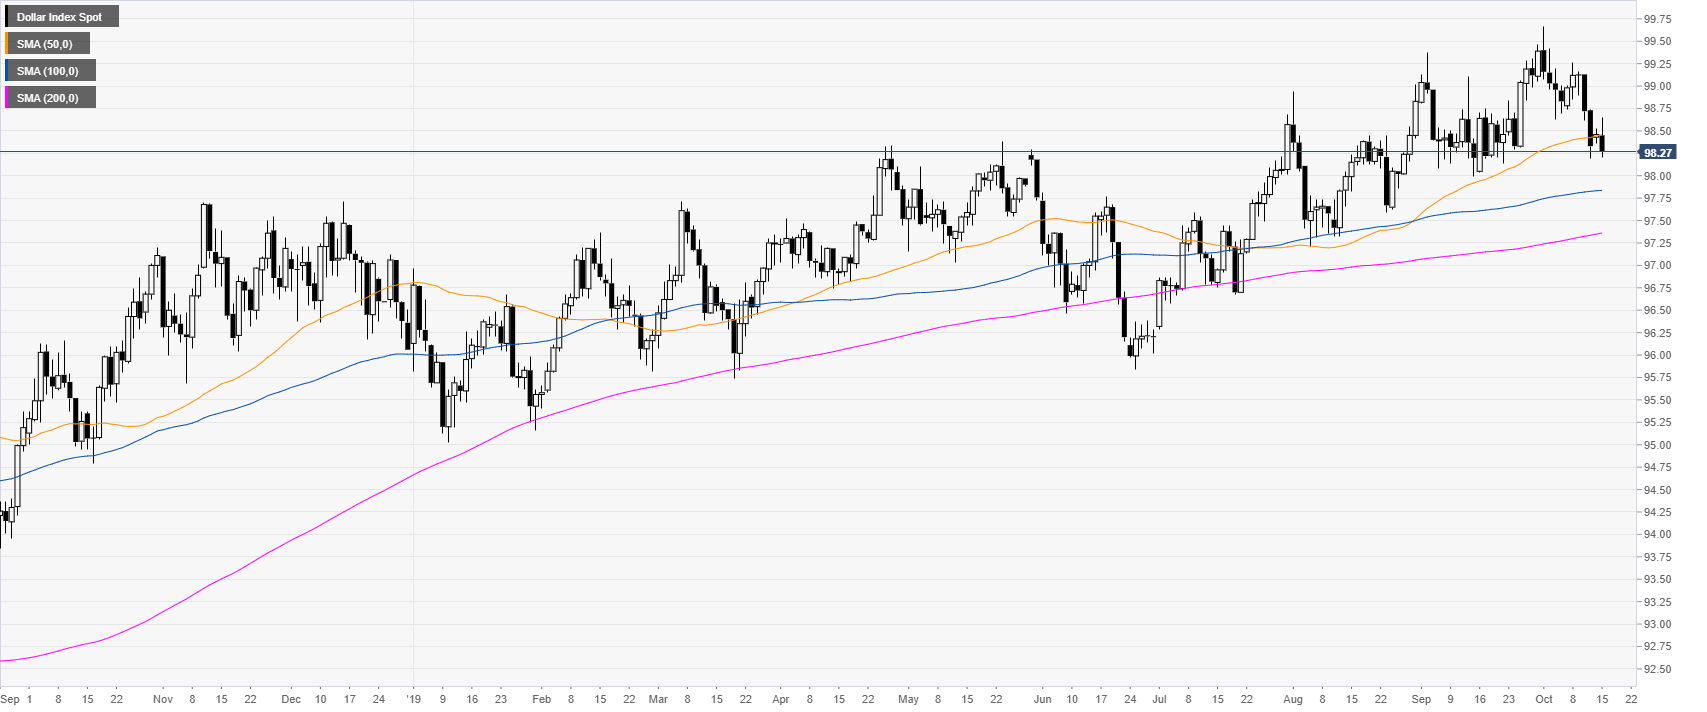
DXY daily chart
The US Dollar Index (DXY) is trading in a bull trend above the 100 and 200-day simple moving averages (DSMAs). This Tuesday DXY failed to move beyond the 98.50 level and the 50 SMA as the Index is about to trade near last week’s lows. On Wednesday, traders will monitor the Retail Sales Control Group in the US.
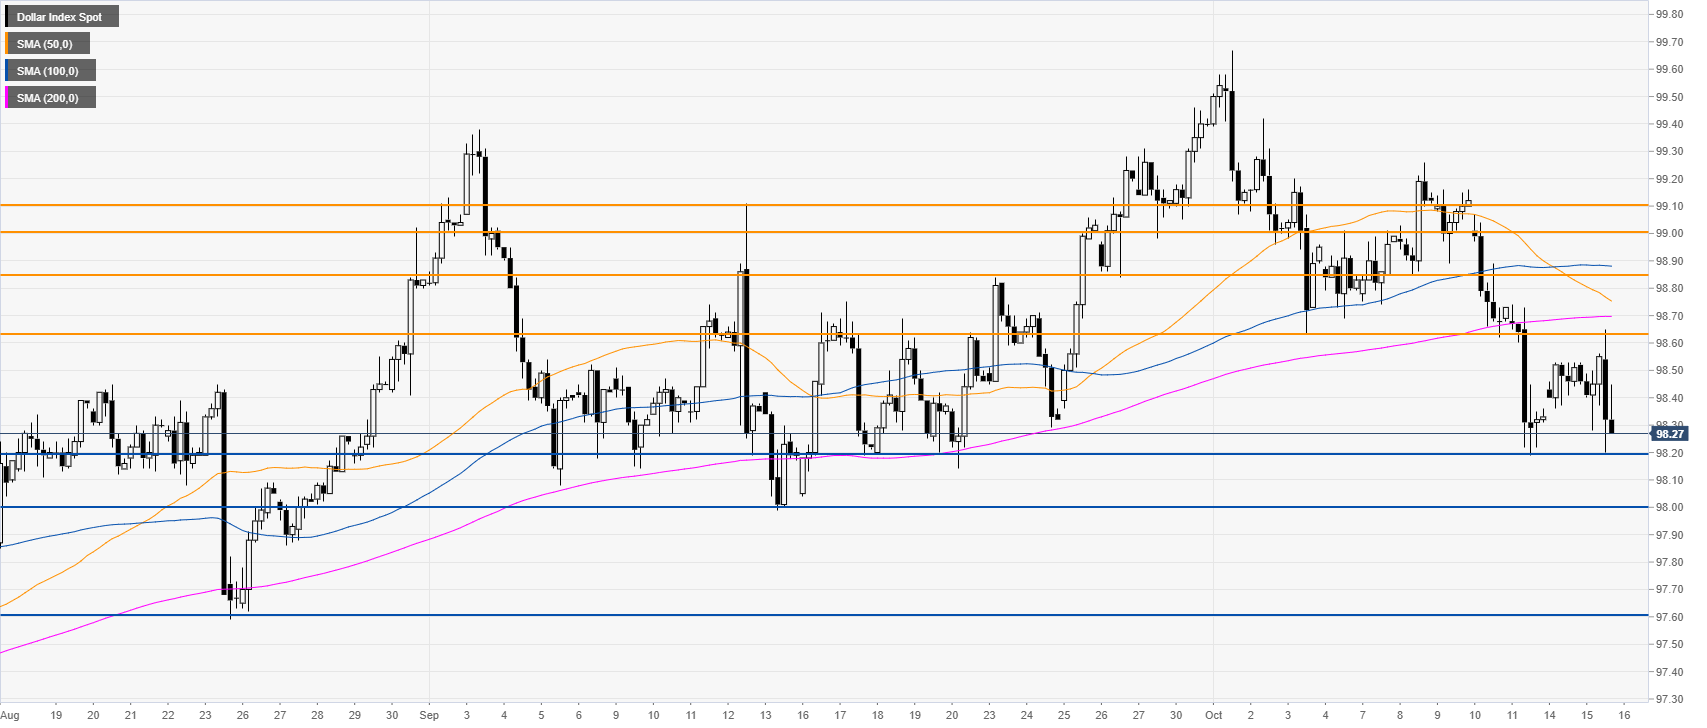
DXY four-hour chart
DXY is under bearish pressure below its main SMAs. If the market breaks the 98.20 support, the Index is likely to challenge the 98.00 handle, which is the September low. If the bulls fail to defend this level, then the market can be set for further losses towards the 97.60 level.
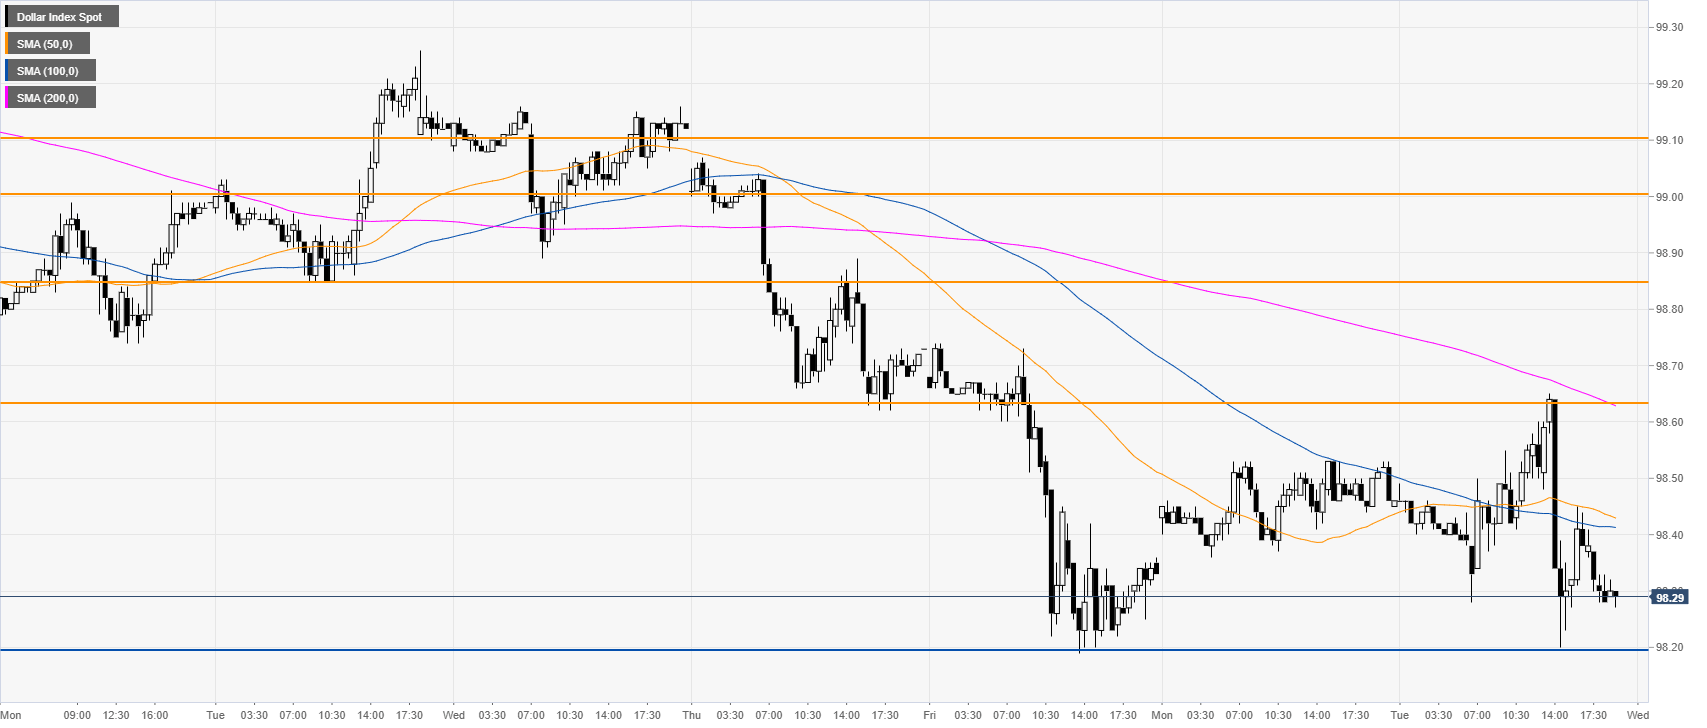
DXY 30-minute chart
DXY is trading below the main SMAs, suggesting a bearish bias in the short term. Bulls would need to have a daily close above the 98.63 resistance to alleviate the bearish pressure.
Additional key levels
