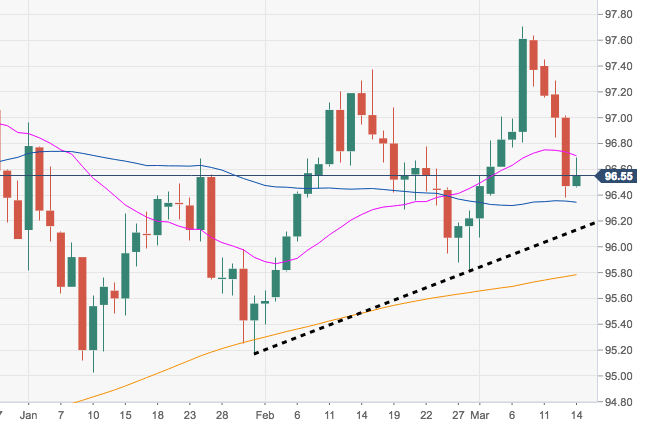
- DXY is attempting a rebound after hitting multi-day lows in the 96.40/35 band on Wednesday.
- Further south, the next support emerges at the 55-day SMA near 96.30 ahead of the short-term support line at 96.13 and late-February lows in the 95.80 region.
- In spite of the underlying weakness, the constructive outlook in DXY is seen unchanged above the critical 200-day SMA, today at 95.78.
DXY daily chart
Dollar Index Spot
Overview:
Today Last Price: 96.53
Today Daily change: 22 pips
Today Daily change %: 0.06%
Today Daily Open: 96.47
Trends:
Daily SMA20: 96.71
Daily SMA50: 96.33
Daily SMA100: 96.57
Daily SMA200: 95.77
Levels:
Previous Daily High: 97.02
Previous Daily Low: 96.38
Previous Weekly High: 97.71
Previous Weekly Low: 96.4
Previous Monthly High: 97.37
Previous Monthly Low: 95.4
Daily Fibonacci 38.2%: 96.62
Daily Fibonacci 61.8%: 96.78
Daily Pivot Point S1: 96.23
Daily Pivot Point S2: 95.98
Daily Pivot Point S3: 95.59
Daily Pivot Point R1: 96.87
Daily Pivot Point R2: 97.26
Daily Pivot Point R3: 97.51
