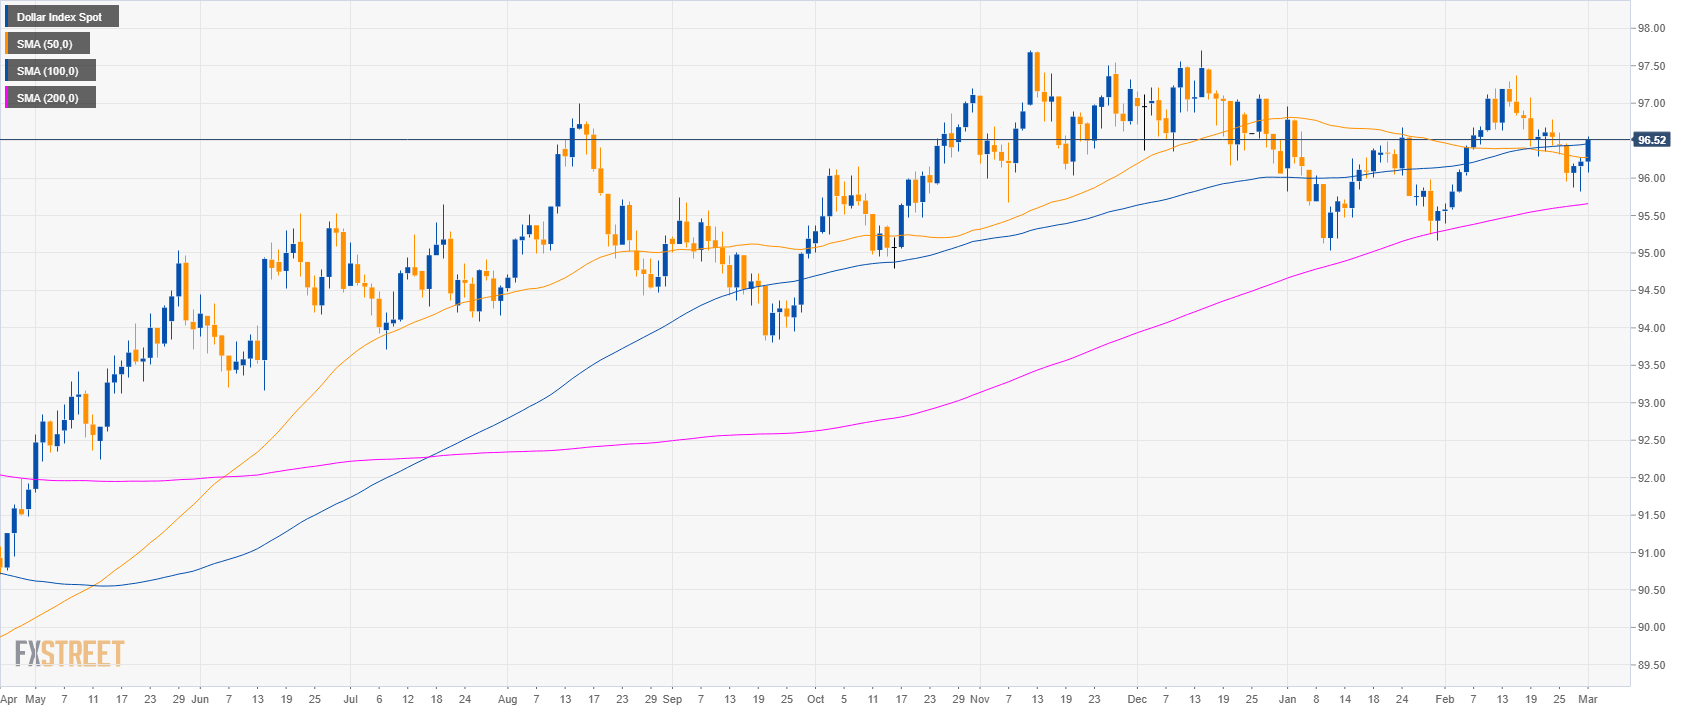
DXY daily chart
- The US Dollar Index (DXY) is trading in a bull trend above its main simple moving averages.
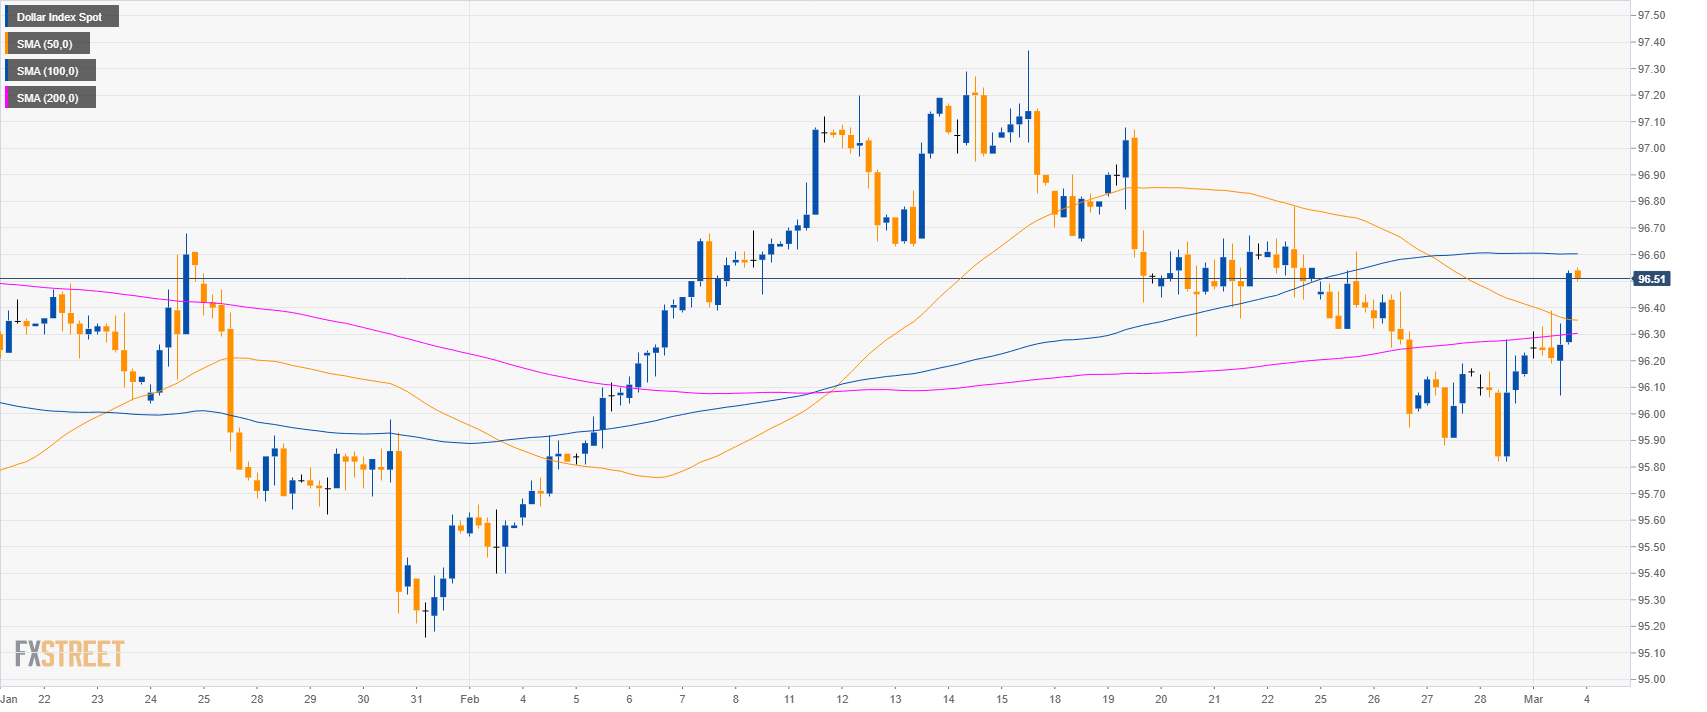
DXY 4-hour chart
- DXY is trading between the 50 and 100 SMAs suggesting a consolidation phase in the medium-term.
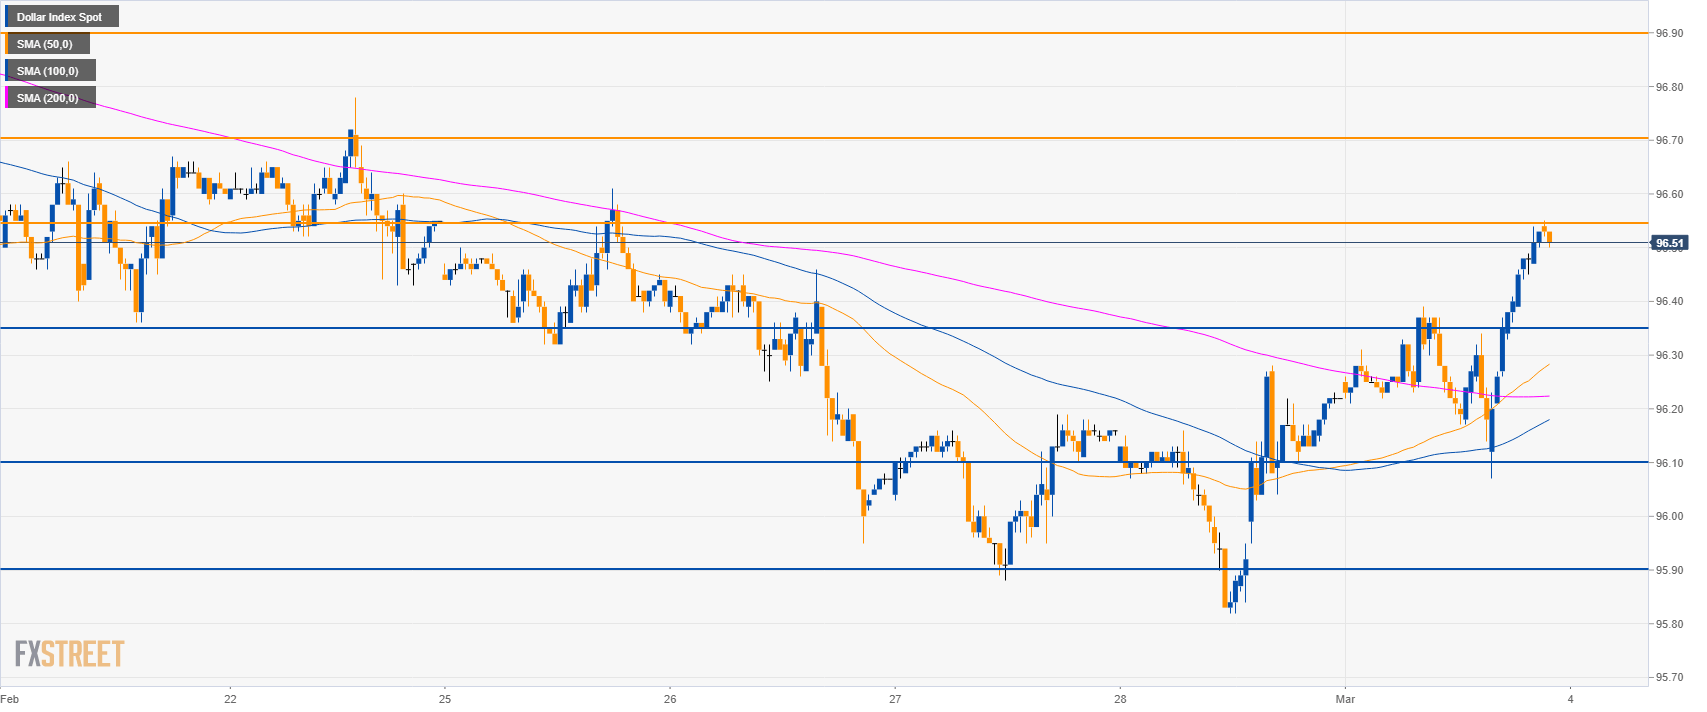
DXY 30-minute chart
- DXY is trading above its main SMAs suggesting bullish momentum in the short-term. However, bulls will need to overcome the 96.55 resistance to reach 96.70.
- A pullback down is more likely with key support at 96.35 and 96.10.
Additional key levels
Dollar Index Spot
Overview:
Today Last Price: 96.52
Today Daily change: 30 pips
Today Daily change %: 0.31%
Today Daily Open: 96.22
Trends:
Daily SMA20: 96.49
Daily SMA50: 96.27
Daily SMA100: 96.44
Daily SMA200: 95.64
Levels:
Previous Daily High: 96.28
Previous Daily Low: 95.82
Previous Weekly High: 97.08
Previous Weekly Low: 96.29
Previous Monthly High: 97.37
Previous Monthly Low: 95.4
Daily Fibonacci 38.2%: 96.1
Daily Fibonacci 61.8%: 96
Daily Pivot Point S1: 95.93
Daily Pivot Point S2: 95.65
Daily Pivot Point S3: 95.47
Daily Pivot Point R1: 96.39
Daily Pivot Point R2: 96.57
Daily Pivot Point R3: 96.85
