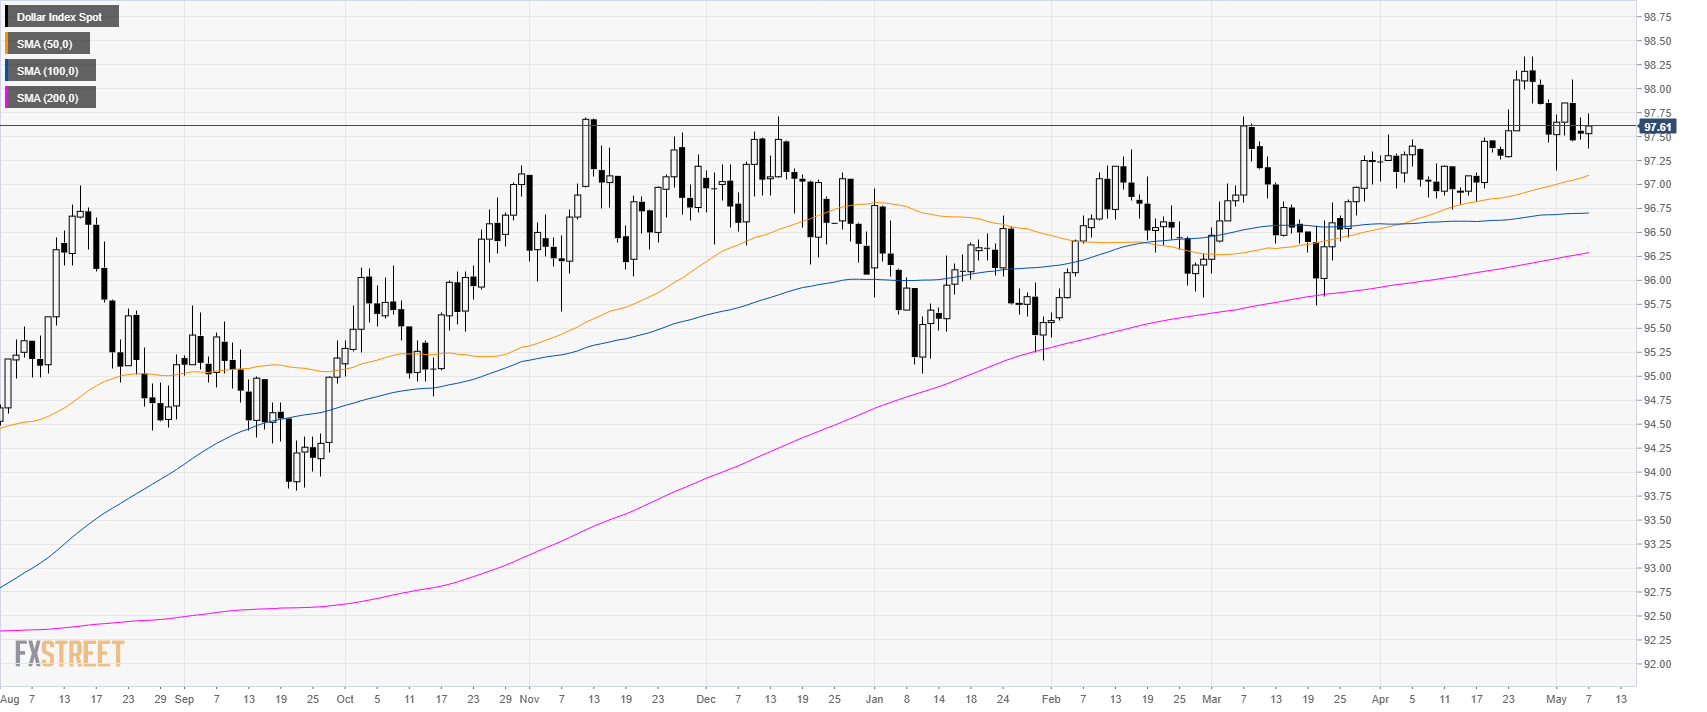
DXY daily chart
- The US Dollar Index (DXY) is trading in a bull trend above its main simple moving averages (SMAs).
- DXY is in demand on the back of US-China trade tensions.
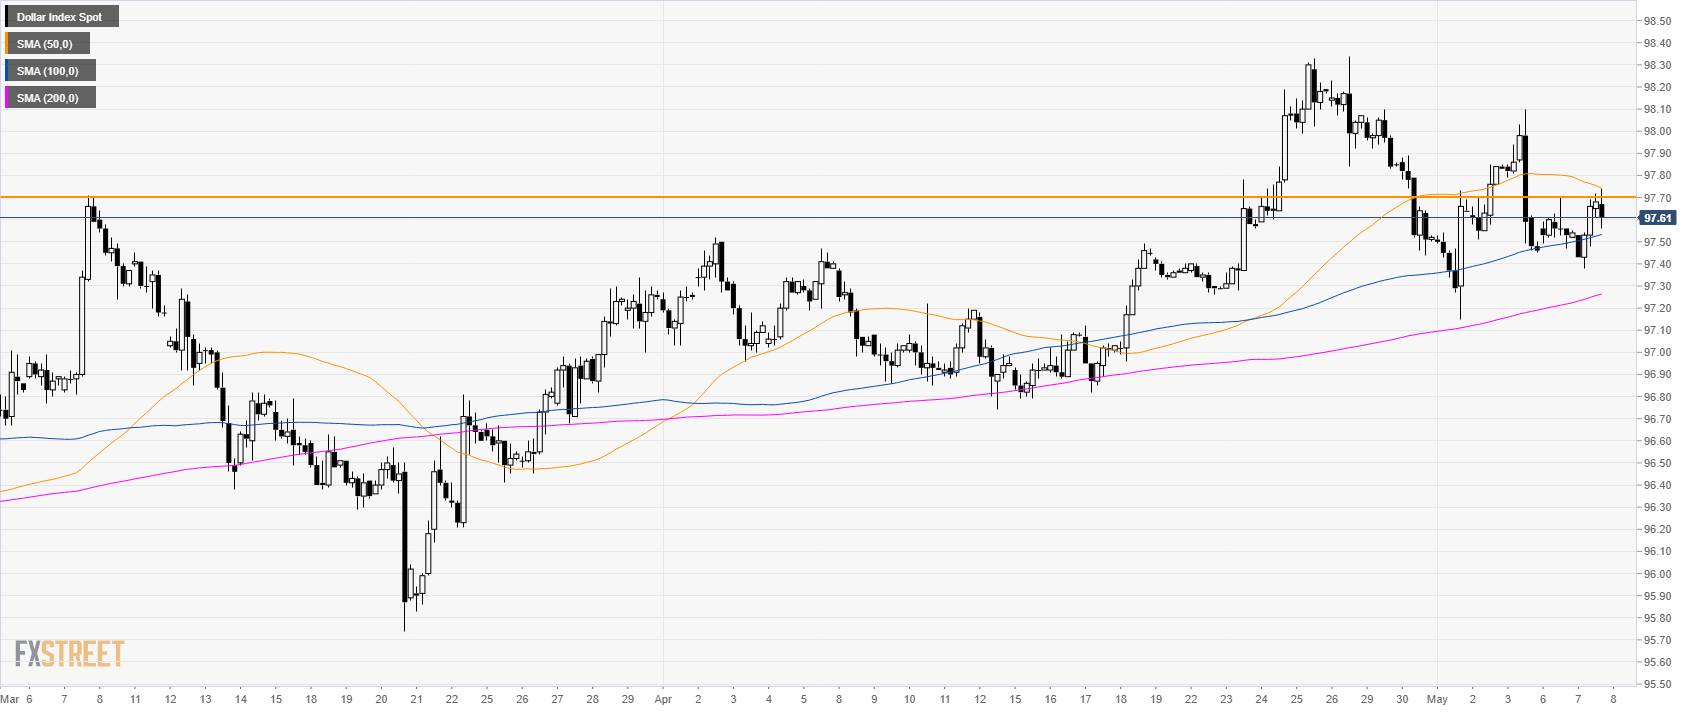
DXY 4-hour chart
- DXY is trading above its main SMAs suggesting bullish momentum in the medium-term.
- 97.70 is the level to beat for bulls.
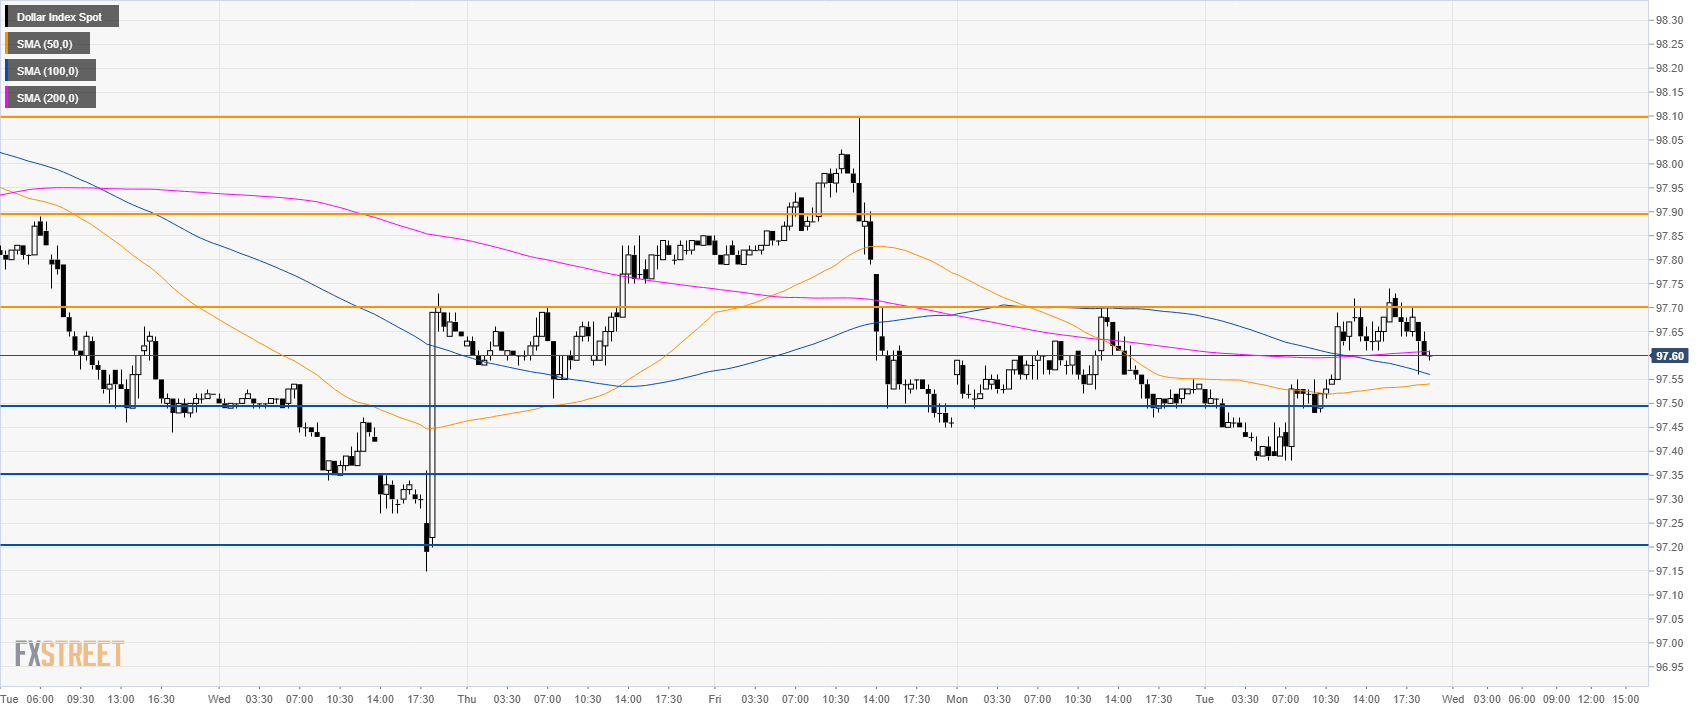
DXY 30-minute chart
- DXY is trading above the 50 and 100 SMAs. However the 200 SMA is flat, all-in-all suggesting a bullish bias in the short-term.
- Buyers created a nice rebound on Tuesday and they will attempt to move beyond 97.70 resistance. A break above this level can lead to 97.90 and 98.10 levels.
- Support is at 97.50, 97.35 and 97.20 level.
Additional key levels
