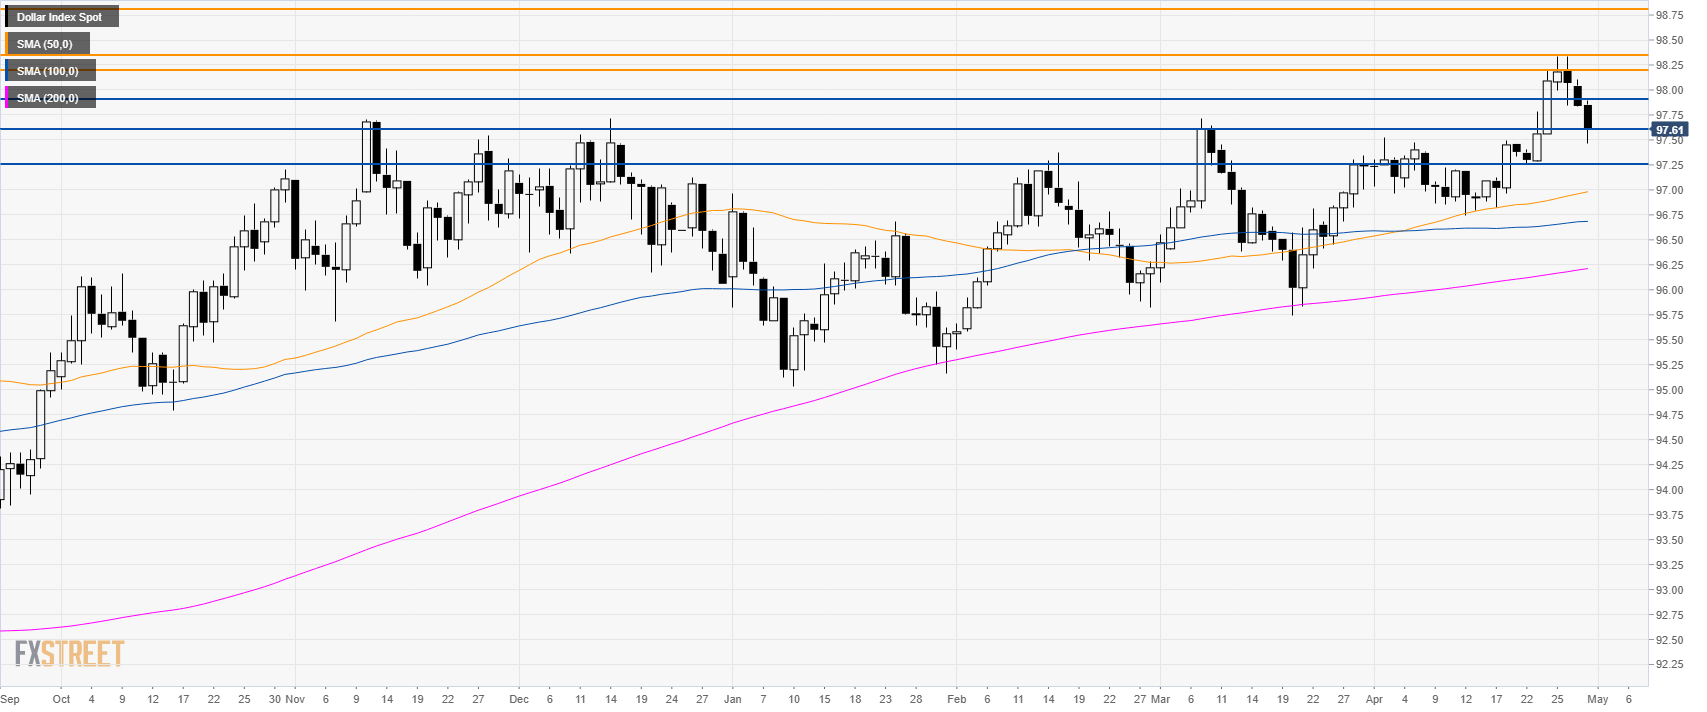
DXY daily chart
- The US Dollar Index (DXY) is trading in a bull trend above its main simple moving averages (SMAs).
- DXY is correcting down for the third day in a row. So far there is no sign that the correction is over.
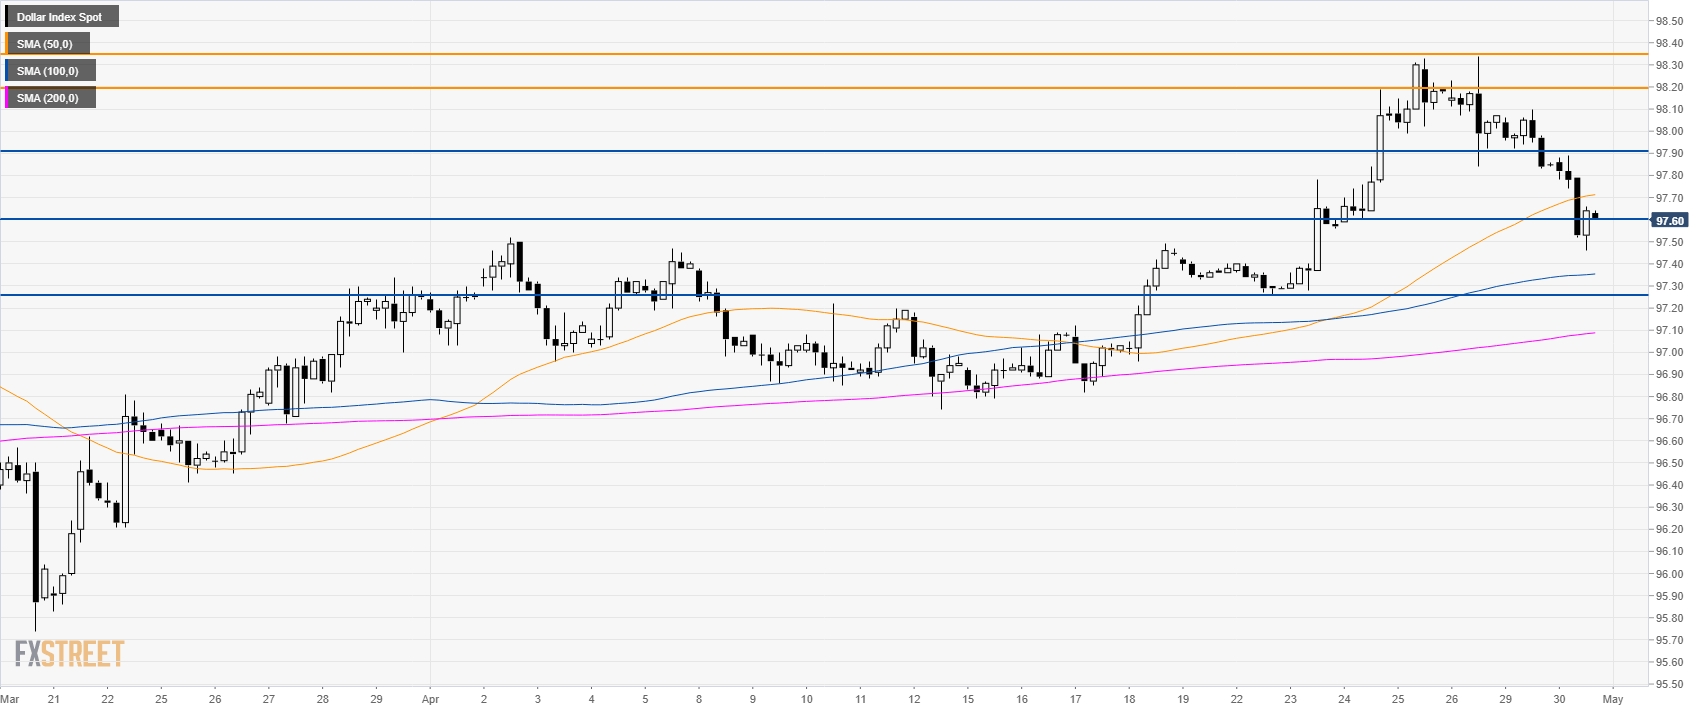
DXY 4-hour chart
- DXY is consolidating the recent losses below the 50 SMA.
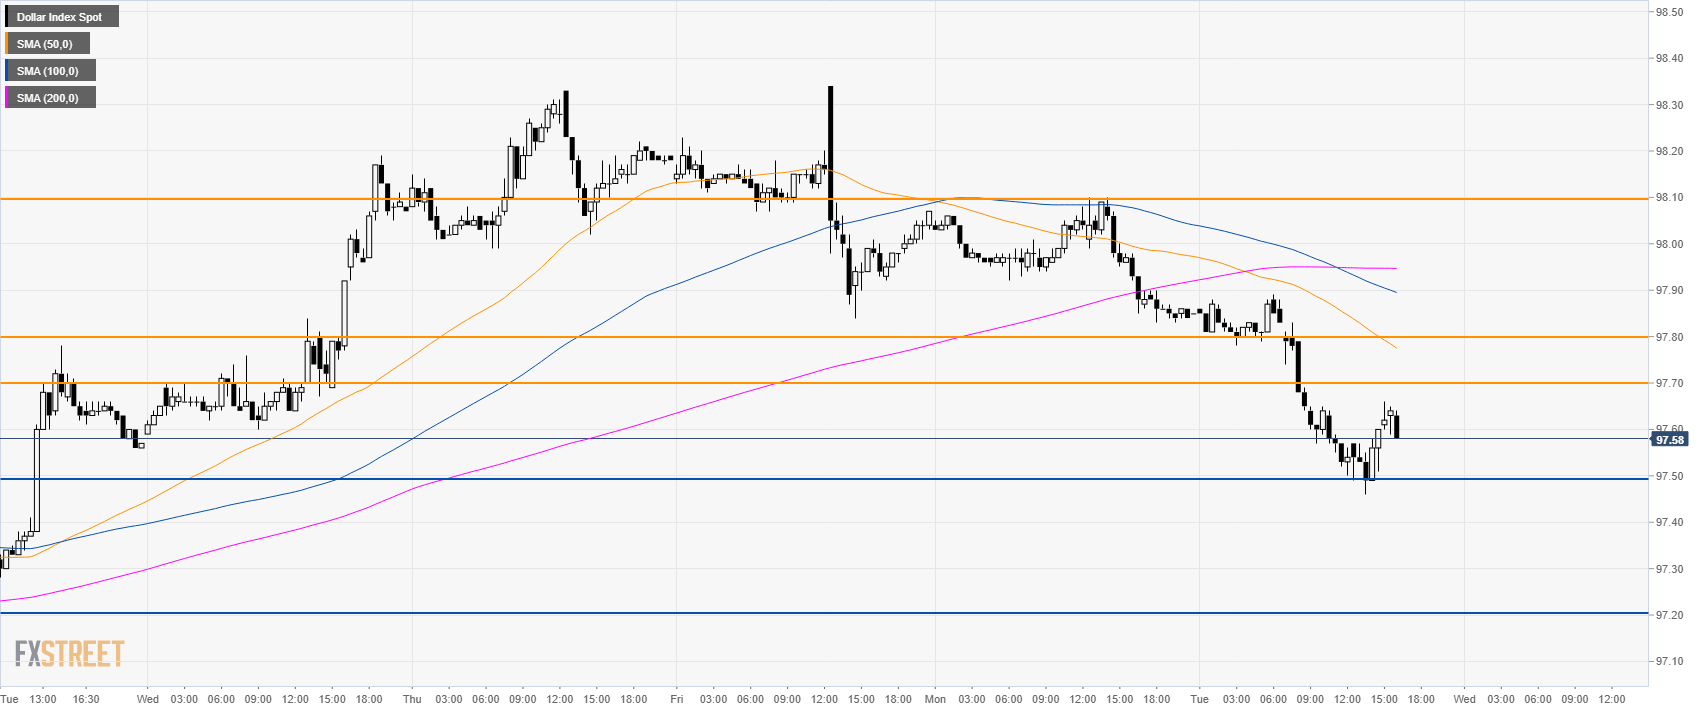
DXY 30-minute chart
- DXY is trading below its main SMAs suggesting a bearish bias in the short-term.
- DXY is having a small rebound at the 97.50 level but it remains to be seen if bulls can sustain prices above 97.70/80 resistances. A break above those levels can open the gates to more gains to 98.10 level.
- A slide below 97.50 would be seen as bearish and can lead to 97.20 to the downside.
Additional key levels
