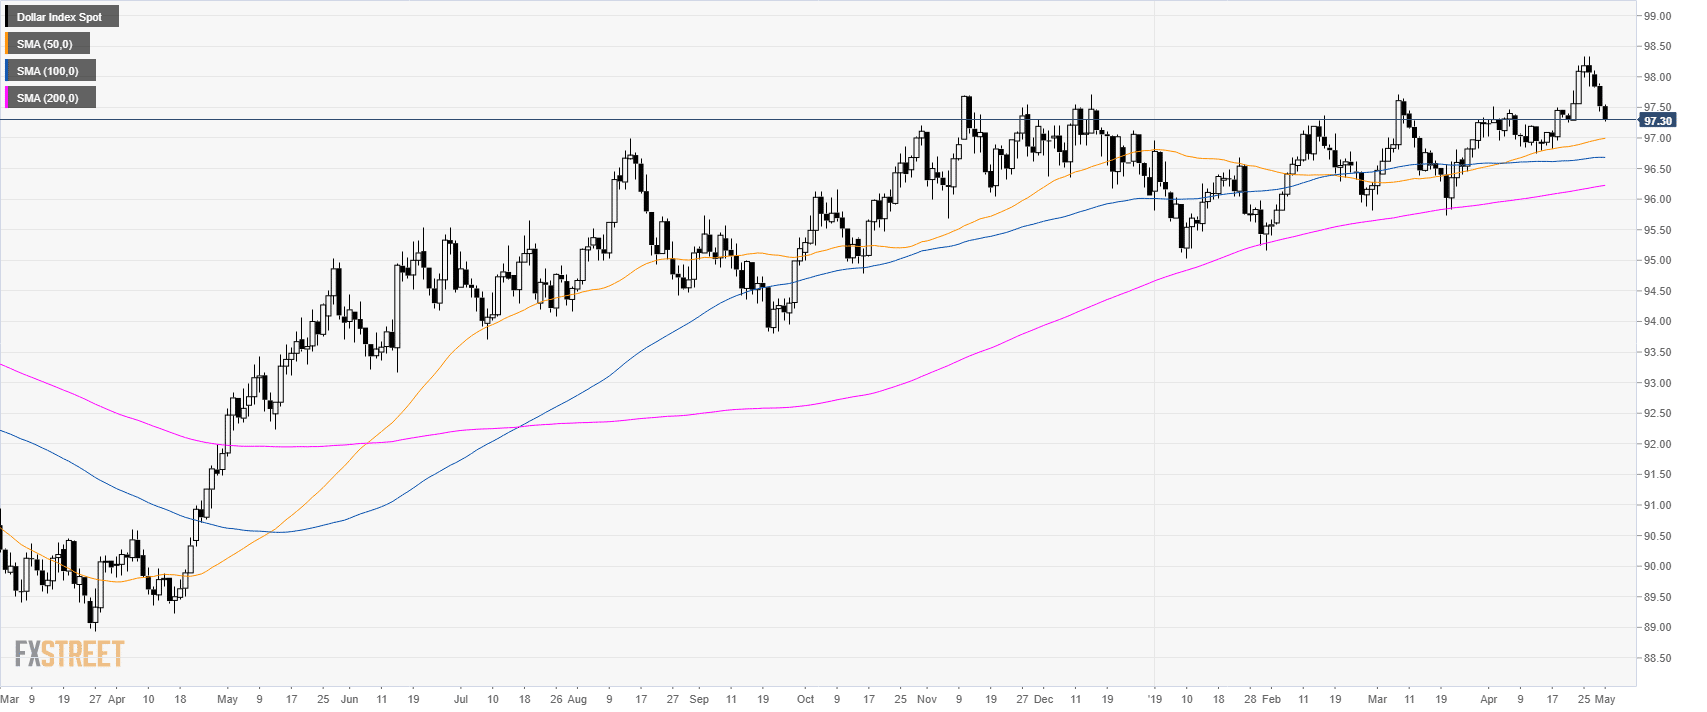
DXY daily chart
- The US Dollar Index (DXY) is trading in a bull trend above its main simple moving averages (SMAs).
- DXY is correcting down for the fourth day in a row.
- Traders will watch the Federal Reserve Monetary Policy Statement at 18:00 GMT for directions in the greenback.
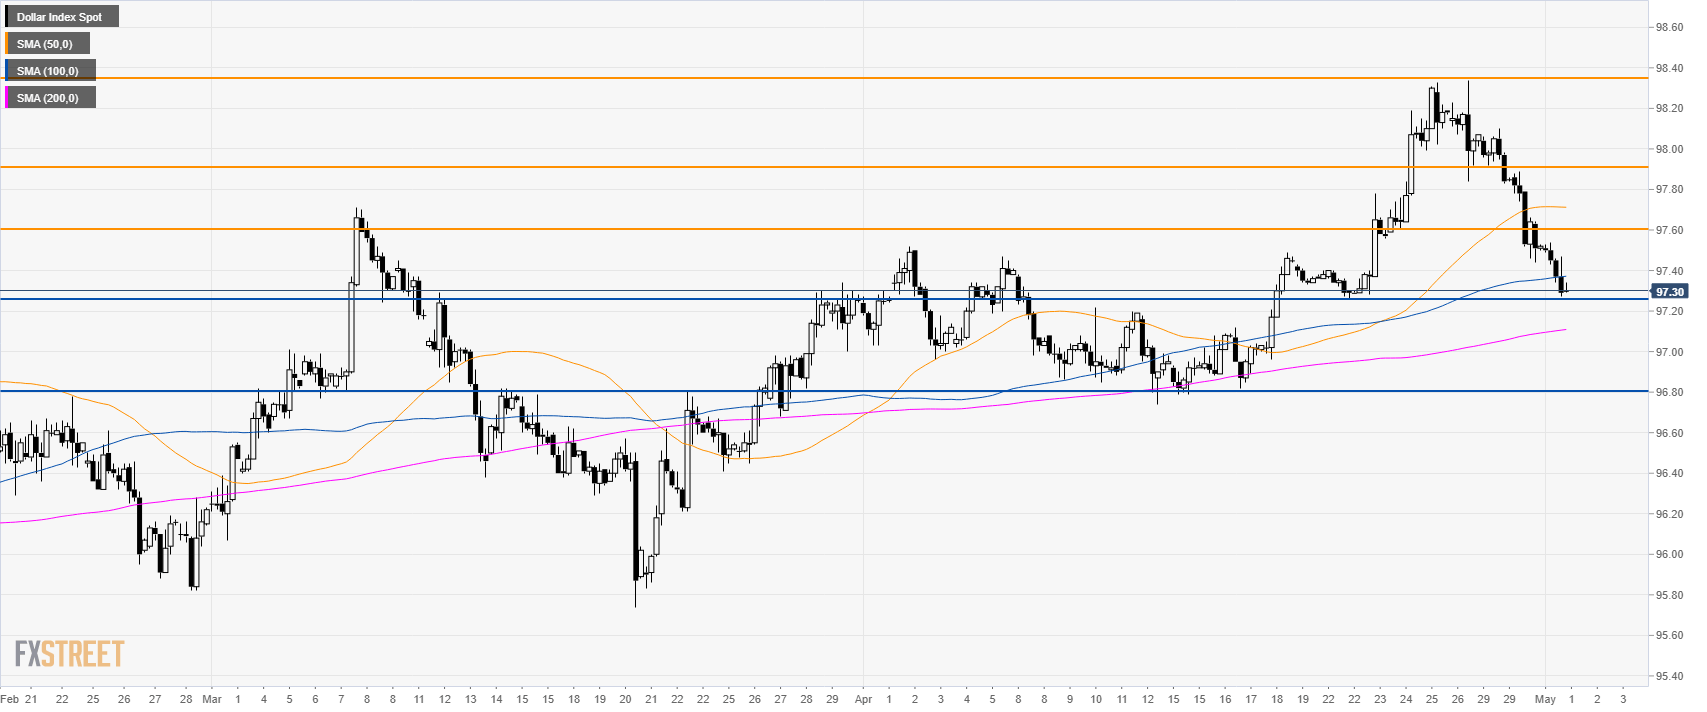
DXY 4-hour chart
- DXY is drifting down below the 50 and 100 SMAs.
- There seems to be no relevant support before the 96.80 level.
- Resistance is at 97.60 and 97.90 level.
DXY 30-minute chart
- DXY is trading below its main SMAs suggesting a bearish bias in the short-term.
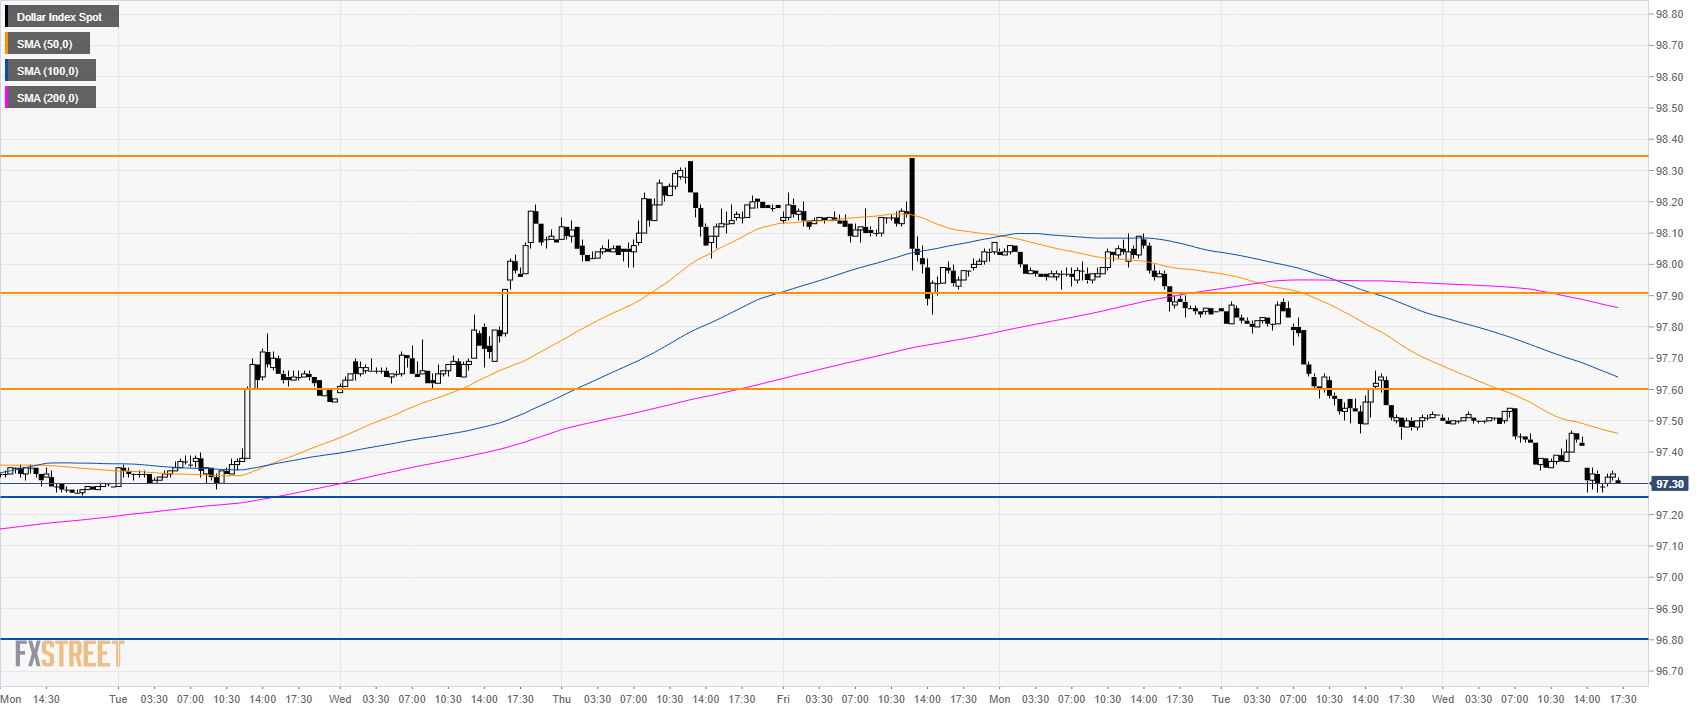
Additional key levels
