- The ISM Non-Manufacturing Index came below expectations at 52.6 in September vs. 55 forecast.
- The level to beat for sellers is the 98.63 figure.
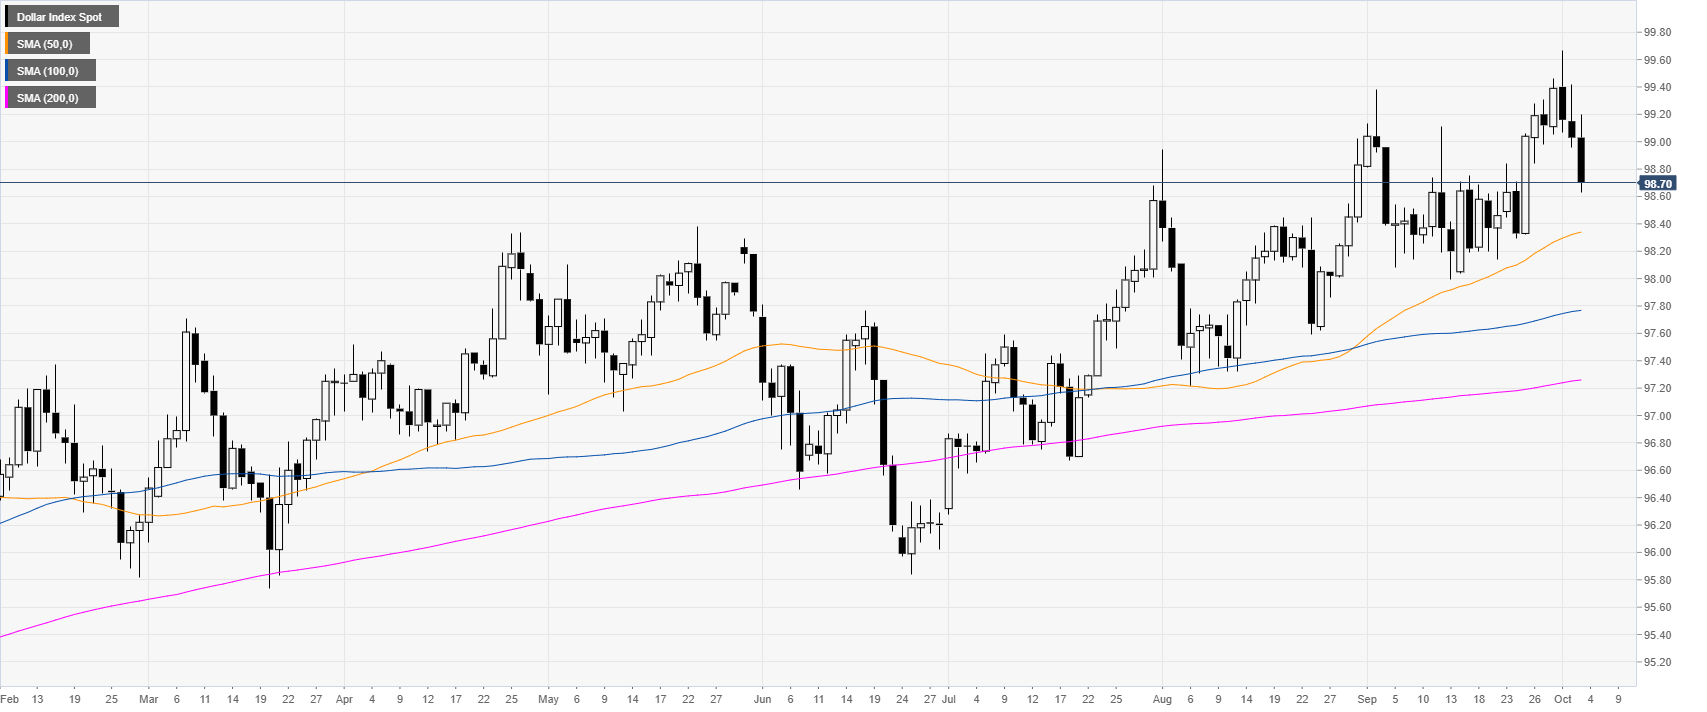
DXY daily chart
The US Dollar Index (DXY) is an uptrend above its main daily simple moving averages (DSMAs). This Thursday, the US ISM Non-Manufacturing PMI dropped to 52.6 in September vs. 55 expected. This adds to the already negative sentiment on DXY which started on Tuesday after the ISM Manufacturing PMI came in at ten-year low at 47.8 vs. 50.1 forecast while on Wednesday, the ADP, the forerunner of the Nonfarm Payrolls scheduled on Friday, disappointed the market with only 135k vs. 140k expected in September.
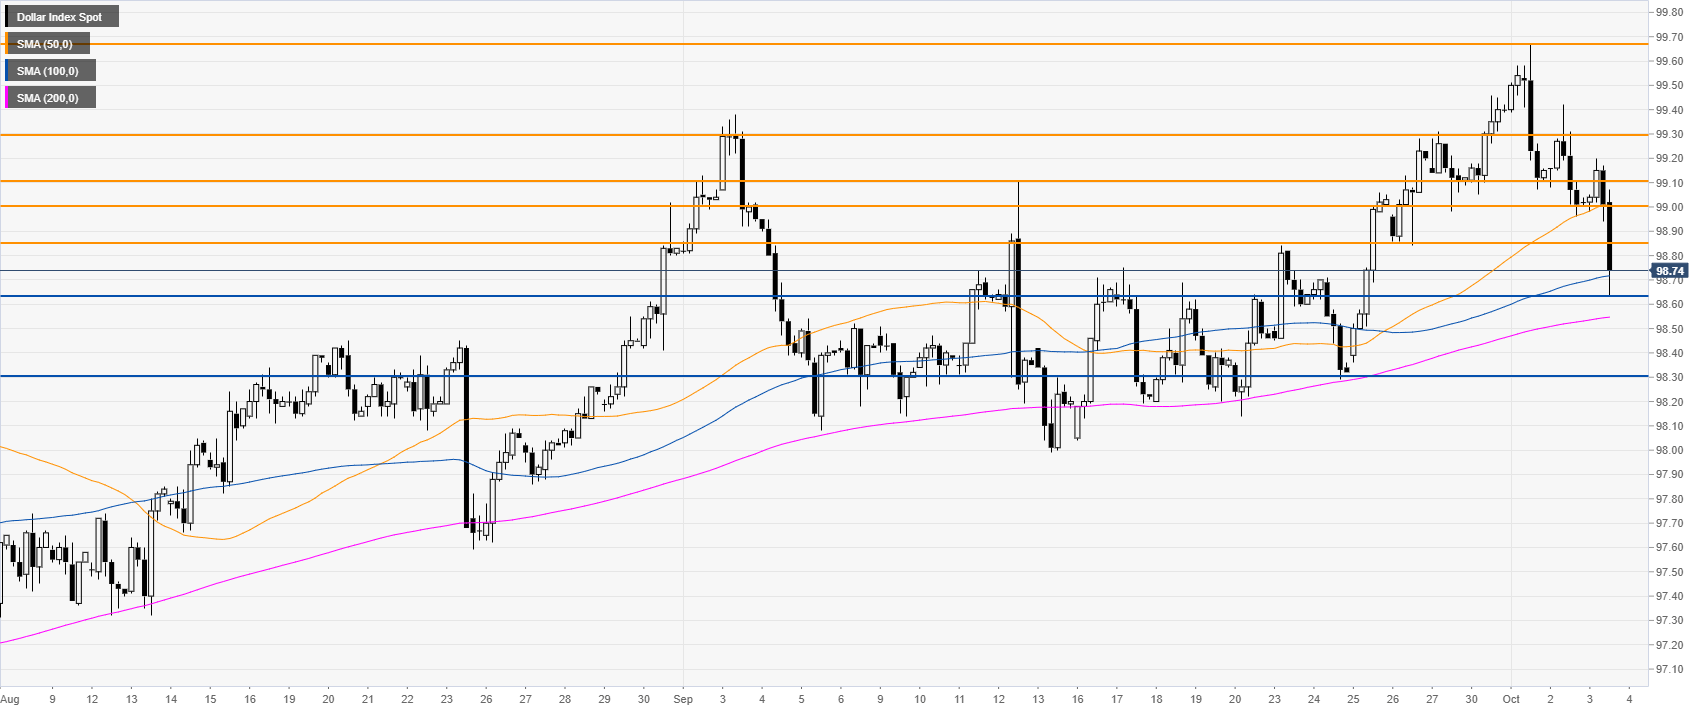
DXY four-hour chart
DXY is retracing down as the market is challenging the 100 SMA. A break of 98.63 (current daily low) can expose the 98.30 level.
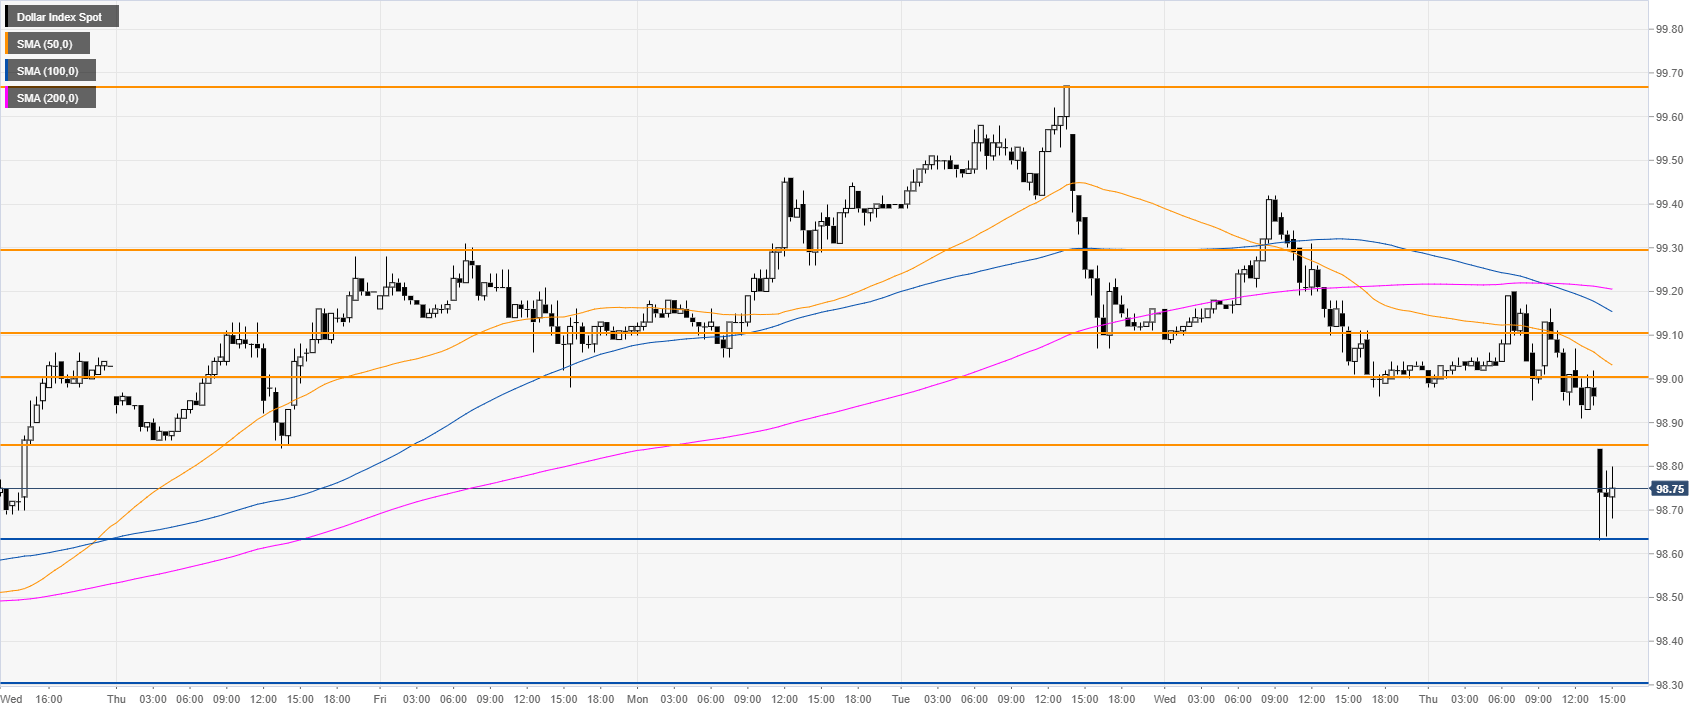
DXY 30-minute chart
DXY is under pressure below the main SMAs, suggesting a bearish bias in the short term. Immediate resistance is seen at the 98.85 and 99.00 price levels.
Additional key levels
