- The US Dollar Index (DXY) is still technically in a bull trend, however, the trend is starting to show signs of weaknesses. DXY is essentially at the same price as in late May of this year.
- DXY is failing to make higher highs since August 15, it is trading below its flat 50-day simple moving average (SMA) and broke below the bull trendline from mid-May. DXY is also forming a head-and-shoulder (bearish) pattern.
- It is currently challenging the 94.43 (August 28 swing low) along with the 100-day SMA. A break below the level will be considered bearish as the Greenback Index would then start making lower highs and lower lows, which is the hallmark of a bear trend. Additionally, indicators such as RSI, MACD and Stochastics are bearish and indicative of lower prices ahead. A break of 94.43 (August 28 swing low) would open the gates to 93.71 (July 9 swing low) and (93.17 June 14 swing low).
- Conversely, a bull breakout above 95.65 resistance would invalidate the bearish case for DXY and this slowdown would then be seen just as another pullback.
DXY daily chart
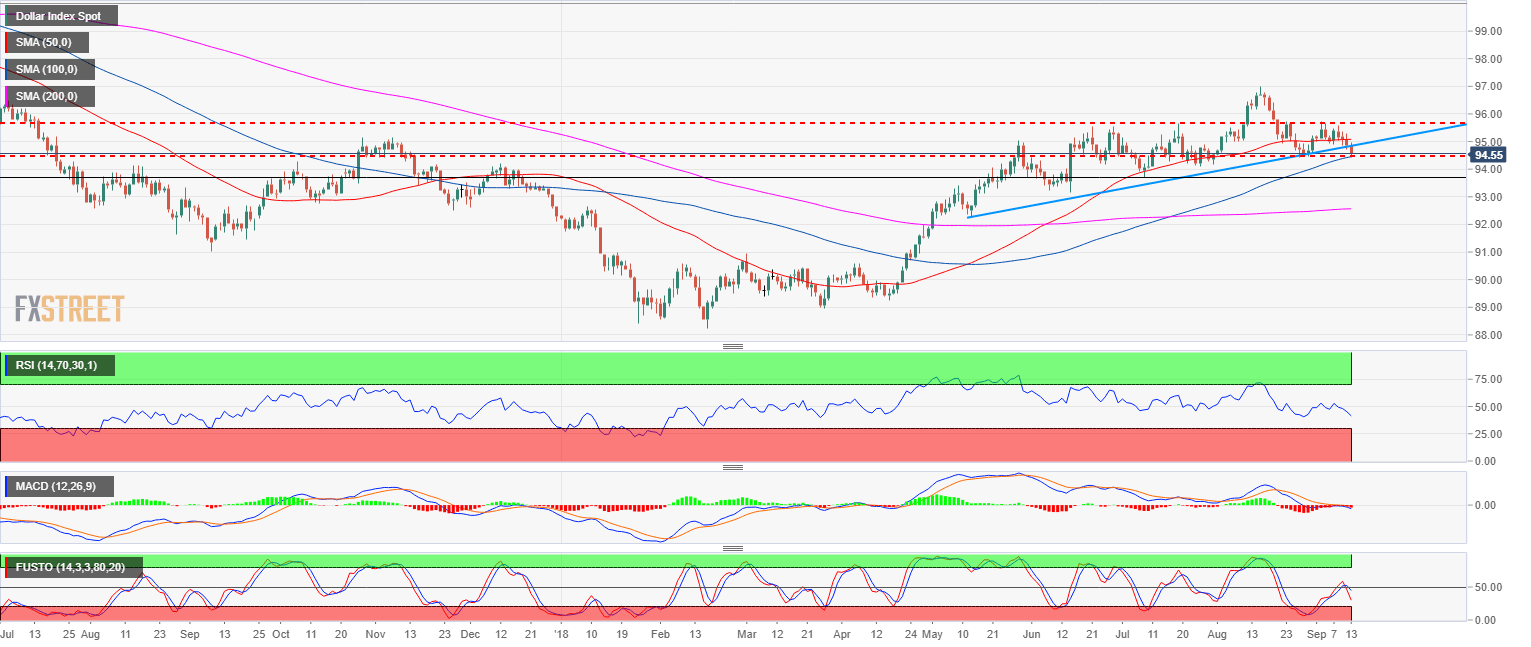
Spot rate: 94.55
Relative change: -0.31%
High: 94.97
Low: 94.43
Trend: Bullish
Short-term: Bearish below 95.65
Resistance 1: 94.91 July 27 high
Resistance 2: 95.00 figure
Resistance 3: 95.24 July 13 high
Resistance 4: 95.52 August 6 high
Resistance 5: 95.65 July 19 high
Resistance 6: 96.00 figure
Resistance 7: 97.00, 2018 high
Support 1: 94.43-45 August 28 swing low, 100-day SMA
Support 2: 93.71 July 9 swing low
Support 3: 93.17 June 14 swing low
Support 4: 92.24 May 14 swing low
