- DXY loses further momentum and recedes from daily tops.
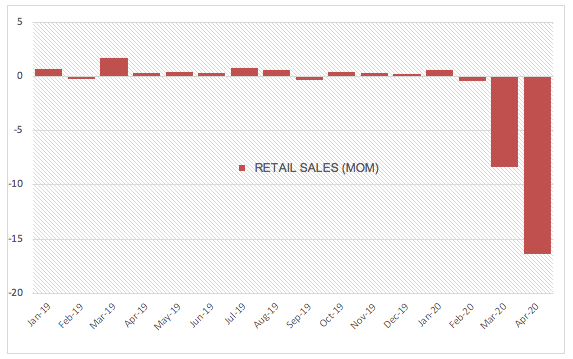
- US Retail Sales collapsed by 16.4% during April, more than expected.
- Industrial Production, U-Mich index coming up next on the docket.
The US Dollar Index (DXY), which gauges the greenback vs. a bundle of its main competitors, has returned to the negative ground and threatens to visit the 100.00 neighbourhood.
US Dollar Index weaker post-data
The index quickly retreated from the area of monthly tops in the 100.50/60 band after headline Retail Sales contracted at a monthly 16.4% during April, much more than forecasted. Core sales followed suit and dropped 17.2% MoM.
Additional data saw the NY Empire State manufacturing gauge rebounding somewhat to -48.5 for the current month after bottoming out at -78.2 in April.
Later in the docket, April’s Industrial/Manufacturing Production figures are due along with Capacity Utilization results and the preliminary print of the Consumer Sentiment by the U-Mich index.
The dollar therefore eroded previous gains after another bout of US-China trade jitters lent extra wings to the index and once again lifted it to the key hurdle in the 100.50 region.
What to look for around USD
The greenback keeps the bullish bias well and sound so far this week against the backdrop of a generalized consolidative fashion in the global markets. In the meantime, the US-China trade war and the gradual re-opening of the US economy continue to be in the centre of the debate among investors. Supporting the momentum around the greenback emerges the current “flight-to-safety” environment, helped by its status of “global reserve currency” and store of value. On another front, and following the FOMC event, the Fed is expected to stay on the loose end of the monetary policy stance, at least until the coronavirus crisis abates.
US Dollar Index relevant levels
At the moment, the index is losing 0.05% at 100.22 and faces the next support at 99.44 (55-day SMA) followed by 99.12 (weekly low May 11) and then 98.57 (monthly low May 4). On the other hand, a break above 100.93 (weekly/monthly high Apr.6) would open the door to 101.34 (monthly high Apr.10 2017) and finally 102.25 (monthly high Mar.9 2017).
