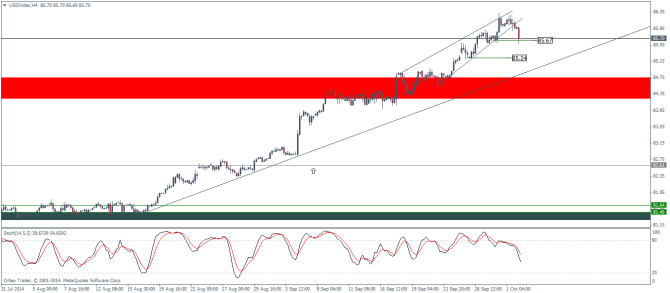
In the previous analysis we had pointed out to possible weaknesses in the US Dollar Index. While we were first expecting to see a retest of support at 81.5 ahead of the resistance level of 84.5, the Dollar Index simply rallied higher and broke this key resistance level. The follow up article then identified an ascending wedge that was starting to form. After a fake out to the downside, Dollar Index managed to get back above the lower support line of the wedge to rally a bit more higher. The exhaustion patterns are quite evident as seen with the current H4 charts with the Dollar Index finally breaking out of the ascending wedge in a gradual fashion, giving this break out to the downside a bit more validity. After a closing high of 86.33, subsequent H4 candles failed to close any higher as well as the highs failed to make any fresh highs.
A breakdown of this ascending wedge could see some reaction to the shorter term support levels at 85.67 and 85.24. The Dollar Index H4 chart also shows the Stochastics crossing lower and pointing to the downside hinting at an interim weakness in the Dollar Index.
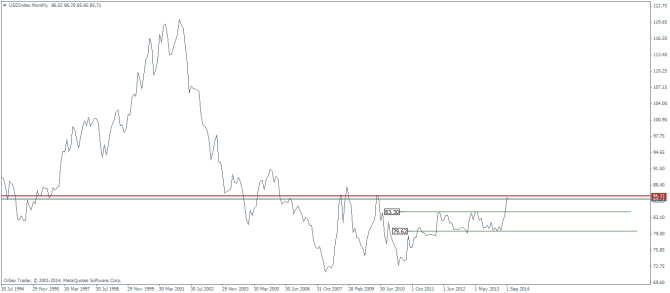
When looking at the monthly charts, there is a strong resistance sitting at 86.33 levels which held during the previous two tests. But with support formed at 79.62, a third test could likely break this resistance to pave way for further gains, especially if the Dollar Index tests the support at 83.3. On the monthly charts, we also notice an ascending triangle pattern currently taking shape, which gives us clues of a possible break out to the upside if the support levels hold near 83.3
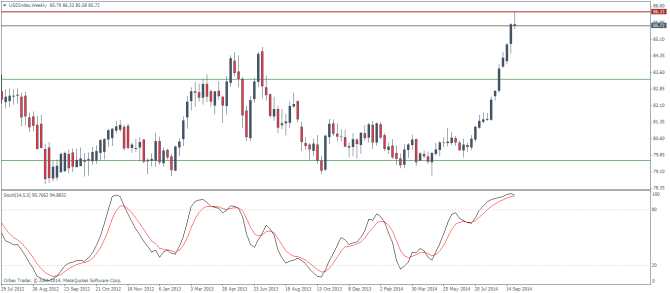
Things start to get very interesting when scaling down to the weekly charts. Here we see a long upper wick formed on this week’s candle, with a high at 86.33, right near the major resistance line mentioned earlier in this analysis. Although it would be premature to draw up on bearish conclusions as we still have another two trading days left, the stochastics oscillator on the weekly charts has been sitting comfortably well in the overbought levels and currently the %K and %D are pointing lower after 11 straight weeks of a bull run in the US Dollar.
The bearish possibilities are further validated with an inside bar formed on the daily charts. Of course, we will have to see a bearish close lower today in order to ascertain a move to the downside. The stochastics on the daily charts are in the overbought levels and look to remain quite strong with an almost flat structure.
The key risk to the US Dollar Index is no doubt the NFP data due to be released tomorrow. After a disappointing print last month, with NFP showing 142k jobs being added v/s 226k consensus and the unemployment rate unchanged at 6.1%, the markets are expecting to see a solid job growth numbers for the month of September. It would take a bullish print to propel the Dollar Index any higher in order to break the resistance at 86.33. Anything short of expectations could see the Dollar Index take a breather and head lower towards 83.3 to establish the support level before resuming its upward trend.
