USD/CAD posted modest gains last week, as the pair closed just shy of the 1.41 line. The upcoming week features three events, including GDP. Here is an outlook at the highlights and an updated technical analysis for USD/CAD.
Retail sales slipped in February to 0.3%, down from 0.6% a month earlier. Core retail sales edged lower to a flat 0.0%, down from 0.1%. Inflation numbers in March were dismal. CPI rose 0.9% year-over-year, down from 2.2% in February. On a seasonally adjusted monthly basis, CPI declined by 0.9%, its biggest decline since the indicator was created in 1992. Trimmed CPI, which excludes the most volatile items in CPI, slowed to 1.8%, down from 2.0%. It was the first time the indicator has fallen below the 2% threshold since February 2019.
In the U.S., jobless claims dropped to 4.4 million, down from 5.5 million a week earlier. In the past 5 weeks, new jobless claims have totaled a staggering 26 million, as the Covid-19 crisis has shut down much of the U.S. economy. There was more bad news from March durable goods orders, which plunged by 14.4%, its first decline in four months. The core reading declined by 0.2%, after a decline of 0.6%. The UoM Consumer Sentiment slumped to 71.8, down sharply from 89.1 a month earlier. Still, this beat the estimate of 67.8 points.
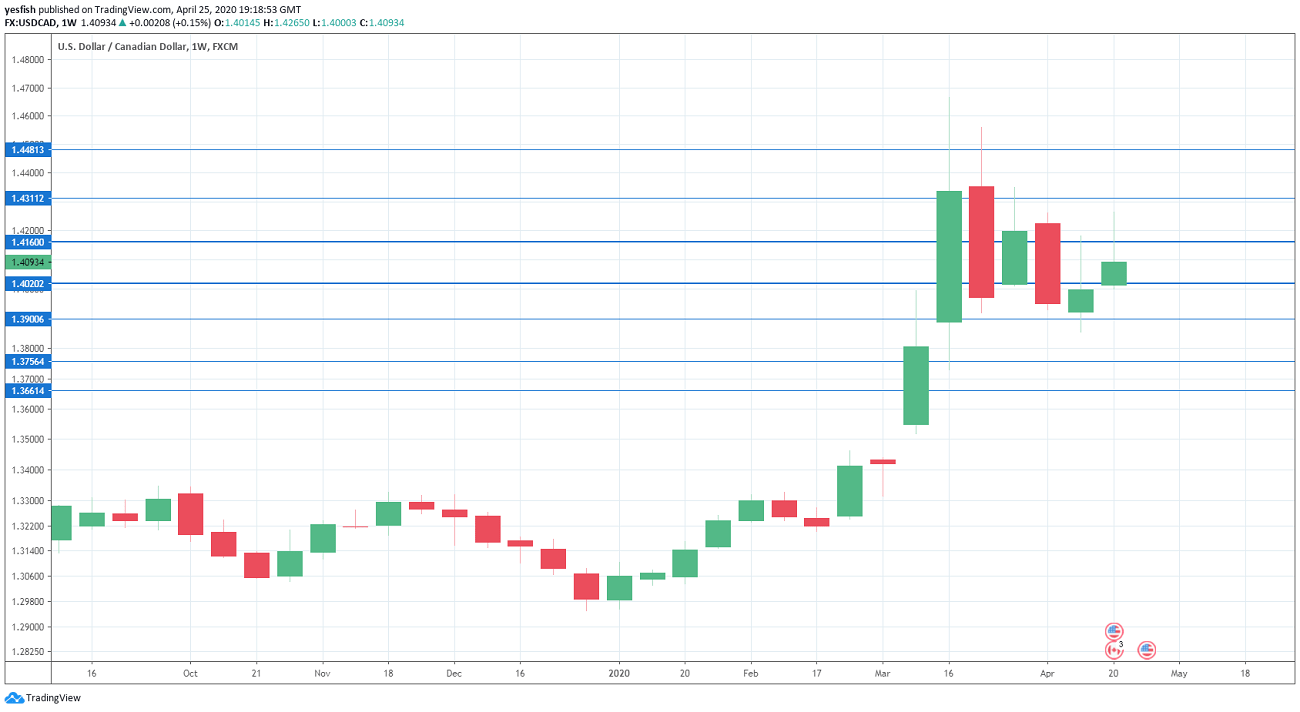
USD/CAD daily chart with support and resistance lines on it. Click to enlarge:
GDP: Thursday, 12:30. Canada releases GDP on a monthly basis. Canada’s economy slowed to 0.1% in January, down from 0.3% a month earlier. The downturn is expected to continue in February, with a forecast of 0.0%.
Raw Materials Price Index: Thursday, 12:30. The indicator has posted back-to-back declines, as inflation levels remain low. In February, the index fell by 4.7%, worse than the estimate of -2.0 percent. This marked the sharpest decline since July. We now await the March data.
Manufacturing PMI: Friday, 13:30. After six successive readings pointing to expansion, the indicator slipped below the 50.0 level in March, falling to 46.1 points. Will we see an improvement in the upcoming release?
USD/CAD Technical Analysis
Technical lines from top to bottom:
1.4480 was an important cushion in April 2000. 1.4310 is next.
1.4159 (mentioned last week) has some breathing room in resistance.
1.4019 has switched to support after USD/CAD gained ground last week.
The round number of 1.39 has some breathing room in support. 1.3757 is next.
1.3660 is the final support level for now.
I remain bullish on USD/CAD
The outlook for the Canadian dollar remains negative, as economic numbers are reflecting the economic fallout due to Covid-19. Risk appetite for minor currencies like the Canadian dollar remains weak. As well, low oil prices are also weighing on the Canadian dollar.
Kenny Fisher - Senior Writer
A native of Toronto, Canada, Kenneth worked for seven years in the marketing and trading departments at Bendix, a foreign exchange company in Toronto. Kenneth is also a lawyer, and has extensive experience as an editor and writer.
Kenny's Google Profile
We use cookies to ensure that we give you the best experience on our website. If you continue to use this site we will assume that you are happy with it.