- USD/CAD trades 0.41% lower as there has been a broad-based dollar sell-off on Monday.
- The market has moved toward a previous consolidation high.
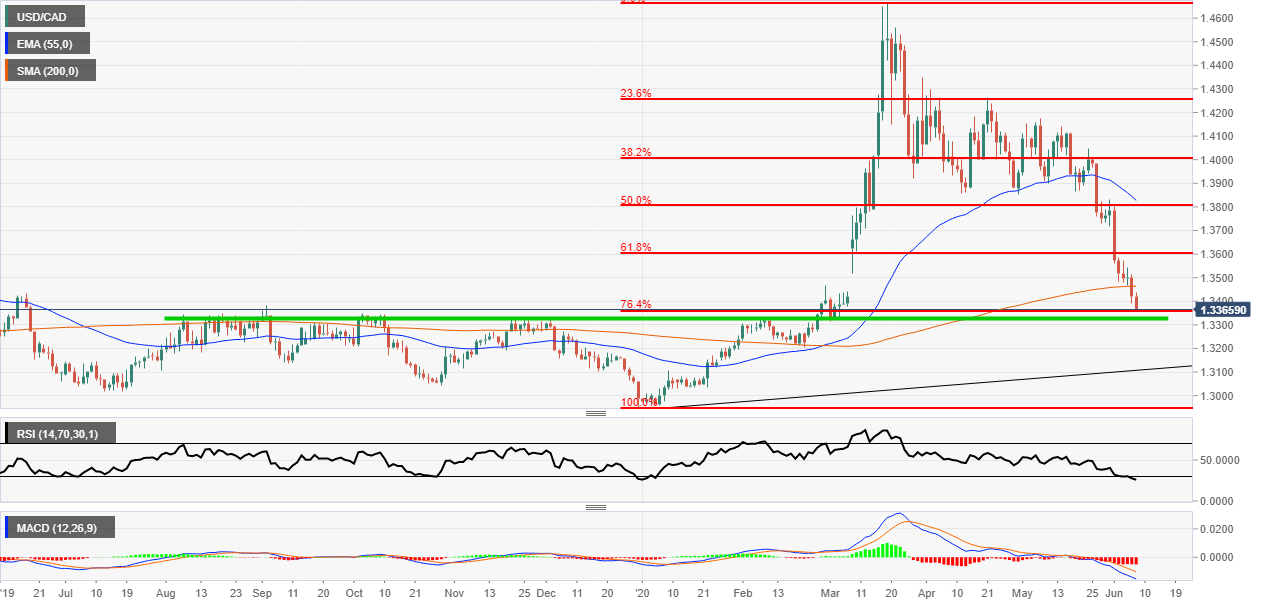
USD/CAD daily chart
USD/CAD has been on a relentless decline as the oil price recovery continues. The US dollar has been under fire recently as the world comes out of the COVID-19 lockdown and economies reopen again. There have also been massive amounts of social unrest in the US which is not helping the greenback in terms of political stability.
As you can see on the daily chart below the market is heading toward to 76.4% Fibonacci zone. This level is also very close to the consolidation high from mid to late 2019. The green horizontal support level stands at the 1.3330 level and the low of the session so far holds at 1.3361 a mear 30 pips away.
There is not too much point of reading the technical indicators (RSI & MACD) as they are both very far into the oversold zone. The Relative Strength Index is now at its lowest level since 1st January. If the oil price pulls back and the dollar catches a bid and retraces then maybe there could be a retracement over the coming sessions.
Additional levels
