- USD/CAD remains on the back foot below 1.3200.
- Bearish MACD on the weekly chart, sustained break of the monthly support line favor short-term downside.
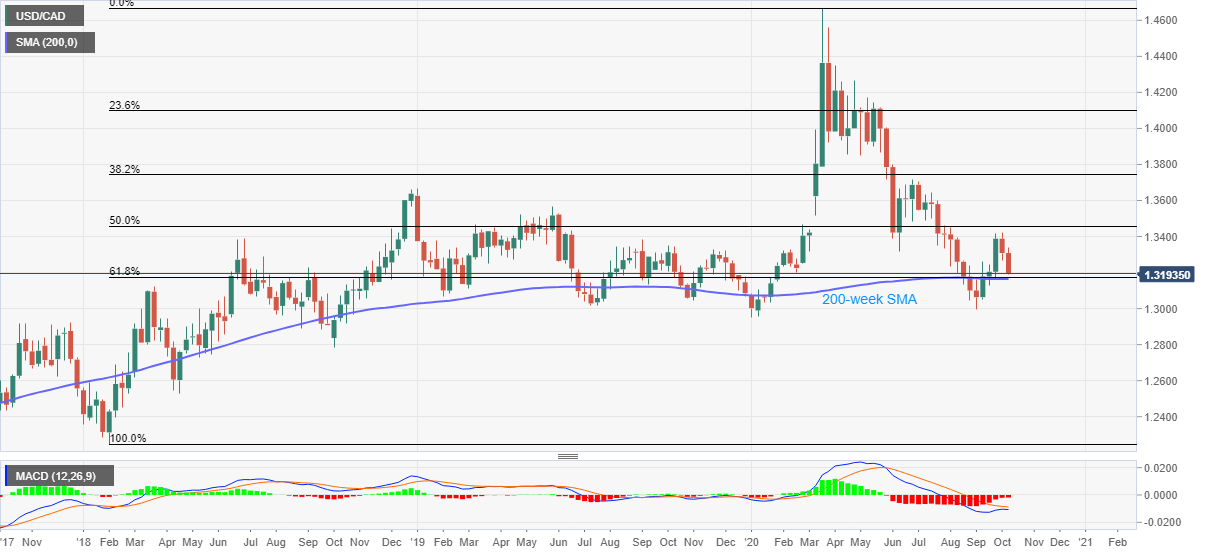
- 200-week SMA, 61.8% of Fibonacci retracement offer the key support.
USD/CAD refreshes the 15-day low while declining to 1.3193 during the early Friday. In doing so, the quote extends the downside break of a monthly support line, triggered late-Wednesday, while flashing the second week of the south-run.
Other than the trend line break, bearish MACD also directs the USD/CAD sellers toward a confluence of 200-week SMA and 61.8% Fibonacci retracement of February 2018 to March 2020 upside.
However, a clear break below 1.3170/65 key support will make the pair vulnerable to challenge the September month bottom close to 1.2995. It’s should be noted that there are multiple barriers around the 1.3100 threshold during the downside between 1.3165 and 1.2995.
Meanwhile, the early September high near 1.3260 can offer immediate resistance to the pair ahead of a downward sloping trend line from September 30, at 1.3306 now.
Also acting as the upside barrier could be the previous month’s peak surrounding 1.3420 and 50% Fibonacci retracement level of 1.3458.
USD/CAD weekly chart
Trend: Pullback expected
