- USD/CAD stays depressed around the lowest in seven months.
- A clear break of the key SMA, support line favor the bears.
- 61.8% Fibonacci retracement of 2017-20 upside gains sellers’ immediate attention.
- Bulls will have to cross a three-year-old trend line for entries.
USD/CAD drops to 1.3157, down 0.10% on a day, as markets in Tokyo open for Wednesday’s trading. The loonie pair has been trading southwards since late June and refreshed the lowest since the early-2020 the previous day.
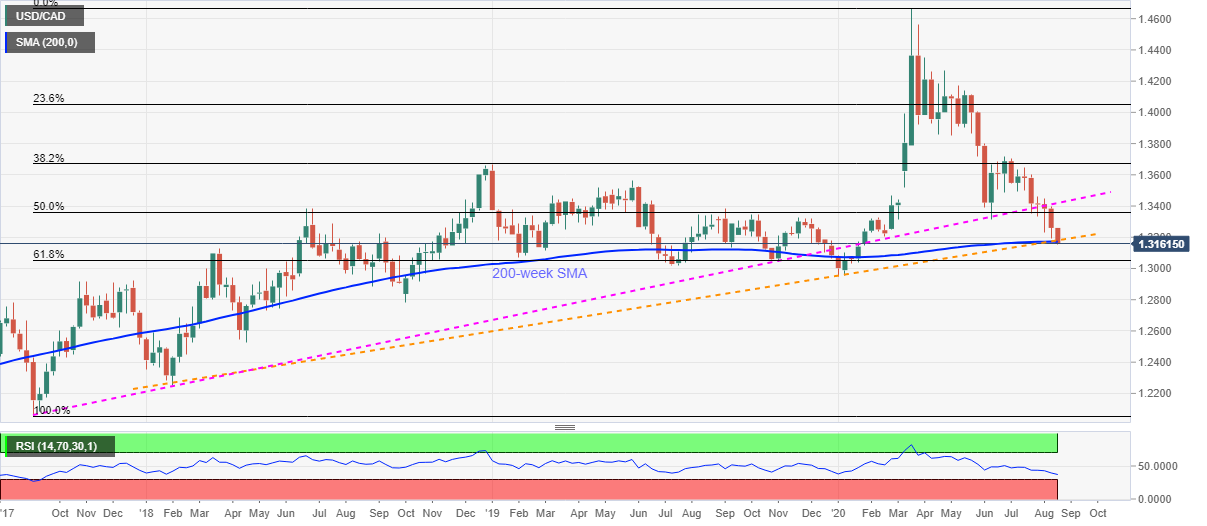
The pair’s declines below 200-week SMA and an ascending trend line from February 2018 could be traced as the latest catalysts to please the sellers.
Considering the break of key supports, the quote is likely to extend the downside towards 1.3100 round-figures as immediate rest-point before attacking 1.3050 level comprising 61.8% of Fibonacci retracement.
During the pair’s further weakness past-1.3050, the 1.3000 psychological magnet and the yearly low near 1.2950 will be the key to watch.
On the flip side, June month low near 1.3315 can entertain the buyers during the pair’s pullback, if any, a break of which will escalate the recoveries to an upward sloping trend line from September 2017, at 1.3420 now.
USD/CAD weekly chart
Trend: Bearish
