- USD/CAD wavers in a choppy range after notable comeback.
- Bullish MACD, risk-off mood favor buyers but 1.2800 holds the gate for further upside.
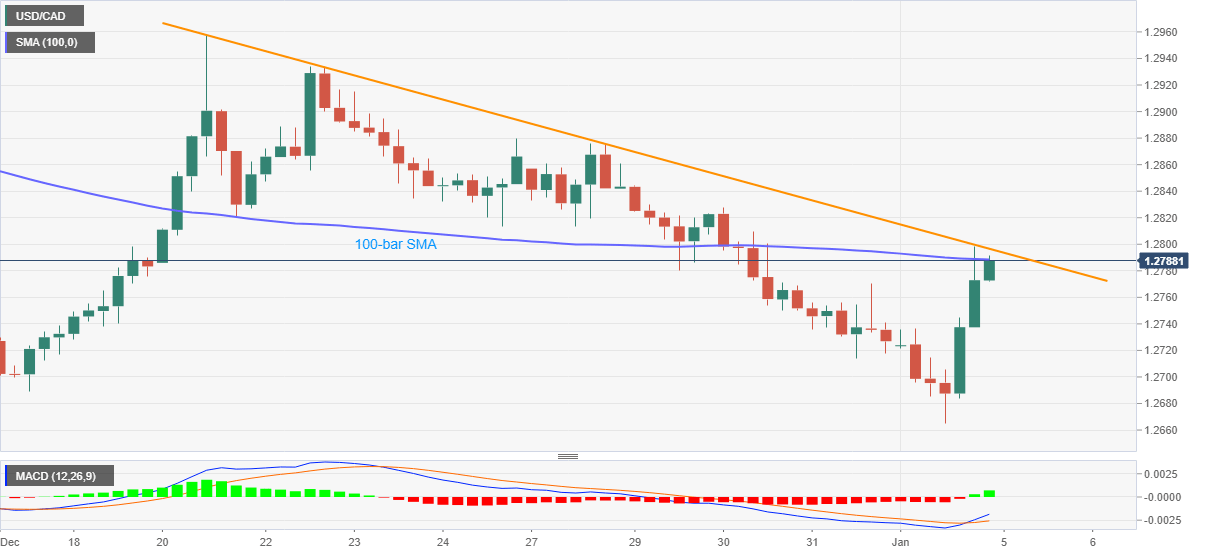
- April 2018 lows can lure sellers should prices revisit sub-1.2700 area.
USD/CAD keeps trading between 1.2770 and 1.2798, currently around 1.2785, during early Tuesday morning in Asia. The pair bounced off a fresh multi-month low the previous day and turned the MACD green.
However, bulls are yet to cross the key upside hurdles, namely 100-bar SMA and a falling trend line from December 21 to retake the controls.
Hence, a clear break above 1.2800 will recall buyers targeting the late December tops near 1.2880 and the 1.2930 resistances.
It should, however, be noted that cautious sentiment will unless USD/CAD crosses the December high of 1.3010.
Meanwhile, fresh selling can wait for a downside break below the 1.2700 round-figure. Following that, April 2018 low near 1.2530/25 will lure the USD/CAD bears.
USD/CAD four-hour chart
Trend: Pullback expected
