- USD/CAD bears catch a breather around the 11-week low.
- Sustained break of 50% Fibonacci retracement, bearish MACD favor sellers.
- A two-month-old falling channel’s resistance questions the bulls.
USD/CAD consolidates losses from multi-day low while taking rounds to 1.3780/85 during the pre-European session on Wednesday.
The Loonie pair dropped to the lowest since March 12 the previous day but fails to extend declines below 100-day EMA afterward.
Even so, sellers cheer the pair’s break below 50% Fibonacci retracement of its upside from December 31, 2019, to March 19, 2020, amid bearish MACD.
As a result, USD/CAD is likely to remain pressured towards the short-term channel’s support line, at 1.3690.
However, its further downside will be challenged by 61.8% Fibonacci retracement level of 1.3605 and 200-day EMA around 1.3580.
Alternatively, the pair’s pullback moves beyond 1.3810 immediate resistance could aim for 1.4000 and the previous week’s top near 1.4050 during further recovery.
It should, however, be noted that the said channel’s resistance line, at 1.4130 now, will still be the key resistance to watch for buyers.
USD/CAD daily chart
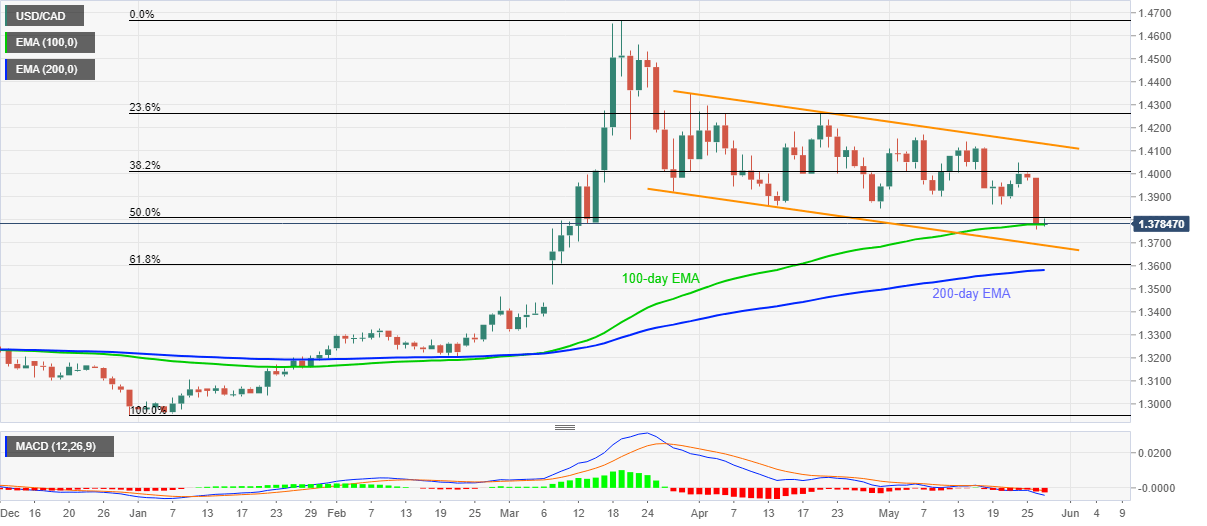
Trend: Bearish
