- USD/CAD remains mildly positive inside a two-week-old descending trend channel.
- 61.8% Fibonacci retracement, 200-bar SMA add to the support below the channel’s lower line.
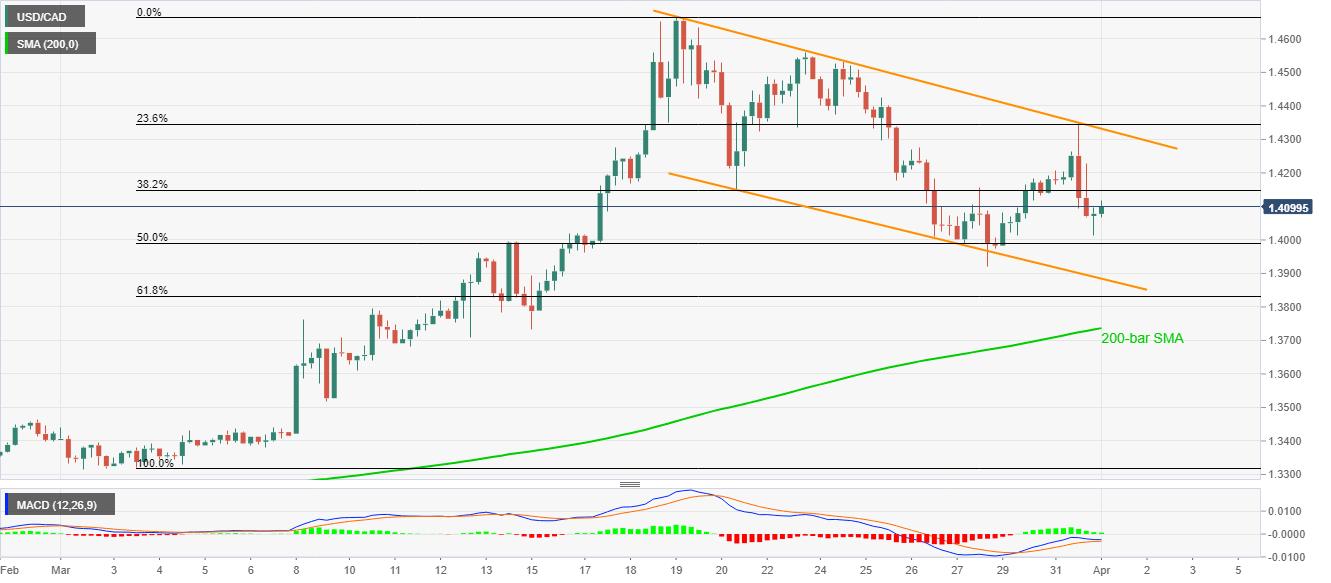
Following its recent pullback from the intraday high of 1.4119, USD/CAD seesaws near 1.4100, up 0.27%, amid the early Wednesday’s trading session. In doing so, the pair remains inside a short-term descending trend channel formation amid bullish MACD.
38.2% Fibonacci retracement level of the early-March upside, around 1.4150, holds the key for the pair’s further recovery towards the channel’s resistance line, at 1.4330. Though, 1.4345 level comprising 23.6% of Fibonacci retracement adds to the upside barrier.
Should there be a clear run-up past-1.4345, the previous month’s high, also the highest levels since early 2016, close to 1.4670, will be on the bulls’ radars ahead of January 2016 top of 1.4690, followed by 1.4700 round-figure.
Meanwhile, the pair’s downside can be challenged by the channel’s support line figures near 1.3885 whereas 50% Fibonacci retracement around 1.3990 can offer immediate support.
During the pair’s declines below 1.3885, 61.8% Fibonacci retracement and 200-bar SMA, respectively, near 1.3830 and 1.3735, could challenge the bears.
USD/CAD four-hour chart
Trend: Bearish
