- USD/CAD is trading near levels last seen in February 2016.
- USD/CAD is challenging the 1.1400 figure.
USD/CAD daily chart
USD/CAD is surging to the upside trading into levels not seen since February 2016 as the quote is challenging the 1.1400 figure. The oil crash is driving the Canadian dollar down and USD/CAD up.

USD/CAD four-hour chart
USD/CAD is having the strongest spike in five years as bulls are challenging the 1.3972/1.4000 resistance zone. A break above the above-mentioned level can see USD/CAD run extend to the 1.4100 level and above according to the Technical Confluences Indicator. Support can be expected near 1.3914 and 1.3871 levels.
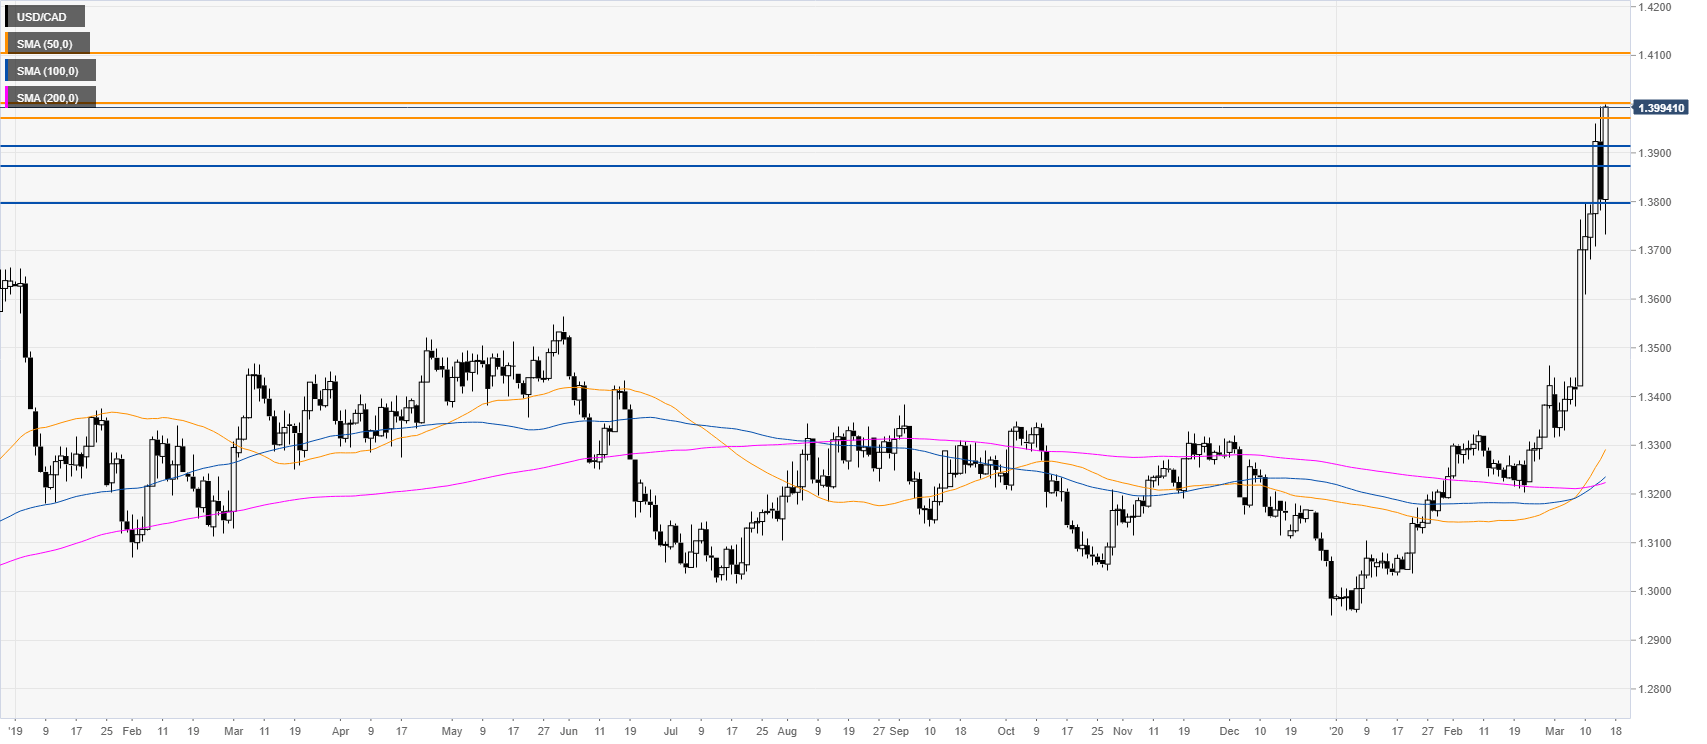
Resistance: 1.3972, 1.4000, 1.4100
Support: 1.3914, 1.3871, 1.3800
Additional key levels
