- USD/CAD pulls back from the five-week top.
- A confluence of 200-bar SMA and 38.2% Fibonacci retracement offers strong intermediate support ahead of the channel’s lower line.
- A seven-week-old horizontal resistance restricts the pair’s upside beyond the channel’s upper line.
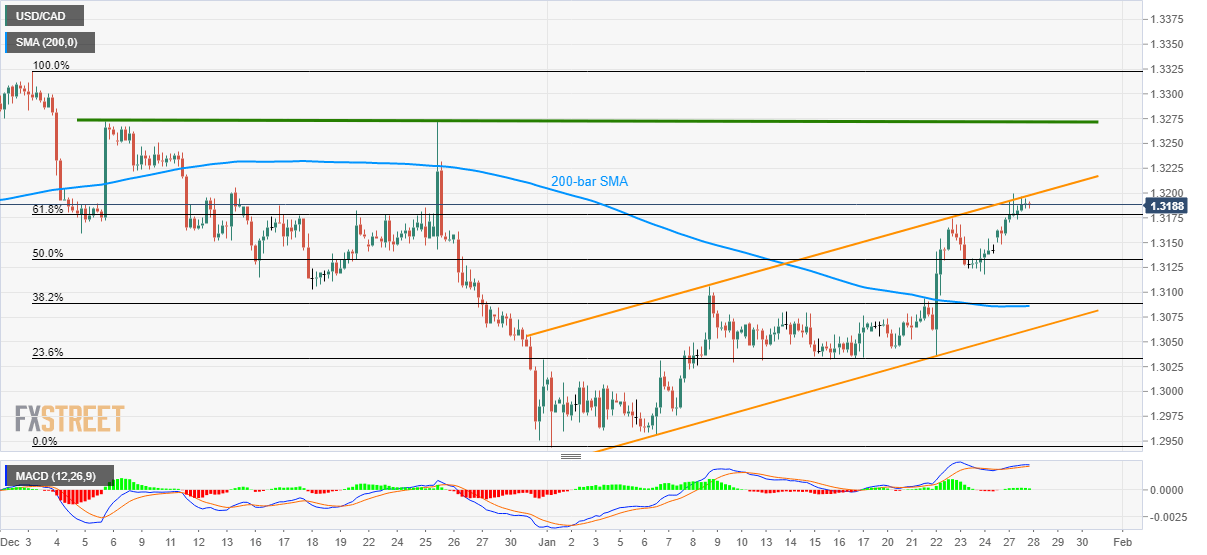
USD/CAD softens to 1.3187 during the pre-European session on Tuesday. The pair recently crossed 61.8% Fibonacci retracement of its fall from early-December 2019 to the start of 2020. However, the upper line of the monthly ascending trend channel seems to restrict the short-term advances.
With this, the quote is likely to revisit 61.8% Fibonacci retracement level of 1.3178, a break of which could drag it to 50% Fibonacci retracement and Friday’s low, around 1.3130 and 1.3115 respectively.
It should, however, be noted that 200-bar SMA and 38.2% Fibonacci retracement near 1.3090/85 will limit the pair’s declines below 1.3115.
Should the bears refrain from respecting 1.3085 support confluence, the channel’s support at 1.3060 will be the key as sellers can take aim at 1.3000 on the break of it.
USD/CAD four-hour chart
Trend: Pullback expected
