- USD/CAD has started to ripen for a bullish correction on the weekly charts.
- Bearish technical conditions still prevail on the daily chart.
The price of the loonie is higher as the US dollar weakness below critical daily resistance in the DXY.
USD/CAD, however, is starting to show signs of tiring on the downside and there could be a buying opportunity for swing traders through 1.2790.
The following is a comprehensive analysis of both the dollar and USD/CAD which illustrates where the bias leans from both a bullish and bearish perspective.
US Dollar implications
Speculators have continued to add bearish bets on the dollar, mostly due to optimism about the global recovery as vaccines are rolled out in major economies.
USD net shorts can still increase before aggregate positioning reaches the -18% lows seen in late September and revamped hopes over US fiscal stimulus package were contributing to lift market sentiment in recent weeks as well.
Fed-induced sell-off
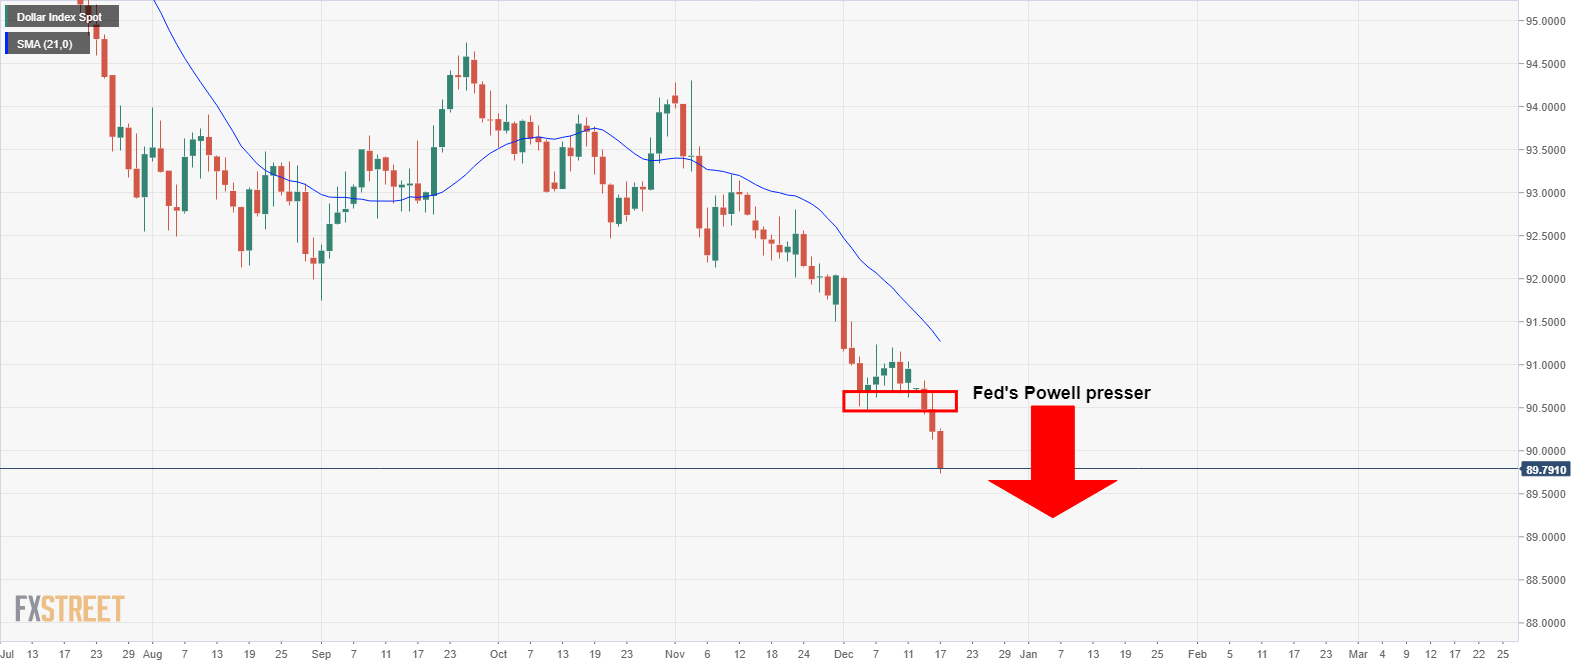
As can be seen, the US dollar has fallen further within this current bearish leg following the Federal Reserve meeting.
Bullish retracement on the cards
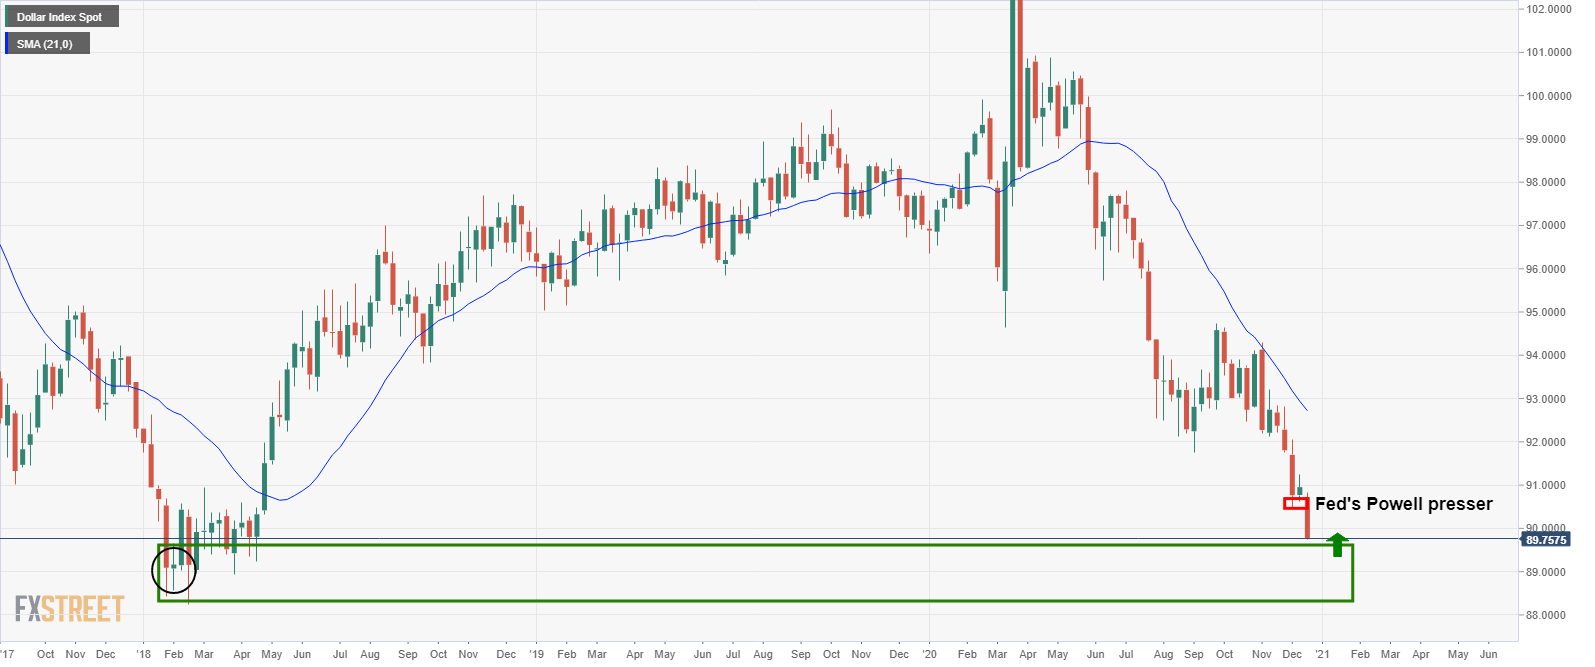
At some stage, the bears will tire and there will be an opportunity to buy into the Us dollar’s correction.
However, there are little signs that the bears are about the throw in the towel and a propper test of the demand zone followed by a period of accumulation/consolidation should be expected.
USD/CAD technical analysis
Nonetheless, there would be a significant correction expected to help fuel the bid in USD/CAD and offer an opportunity to get long.
The following is a top-down analysis of USD/CAD that derives at a conditional bullish scenario.
Monthly chart
-637438305597509499.png)
The price has broken below the monthly point of control where bulls will be looking for an upside correction of this bearish leg.
The most significant level of support is much further down, however. Below it, there is little historic liquidity on a volume profile analysis until the 1.16s.
However, from a lower time frame analysis, we can zoom in on the near term structures from where the price would be expected to correct from.
Weekly chart
-637438336997474697.png)
As illustrated, we can zoom in on the weekly time frame and not the prior market structures fro which the price is currently responding to.
A correction of at least a 38.2% Fibonacci retracement could be expected if this area of support proves to be solid enough. However, the Fibonacci level with the most confluence is that of a 50% mean reversion to 1.2930.
The target would be subject to change in price action and a lower low from the current low of 1.2688.
Daily chart
-637438341042952167.png)
Currently, the price remains in the nads of the bears.
Bulls can only really begin to engage if the price breaks the current resistance through 1.2790 at which point, the 4-hour chart would offer insight to lower time frame price action from which an optimal entry point can be deciphered.
From a positioning standpoint, the improvement in risk sentiment has prompted some short-trimming effect on CAD. Moreover, net US dollar shorts can still increase before aggregate positioning reaches the -18% lows seen in late September.
However, this is defiantly a pair for the buying on correction watchlist.
