- USD/CAD eases from short-term key resistance amid subdued markets.
- Strong RSI, sustained trading beyond 200-SMA and monthly support line back buyers.
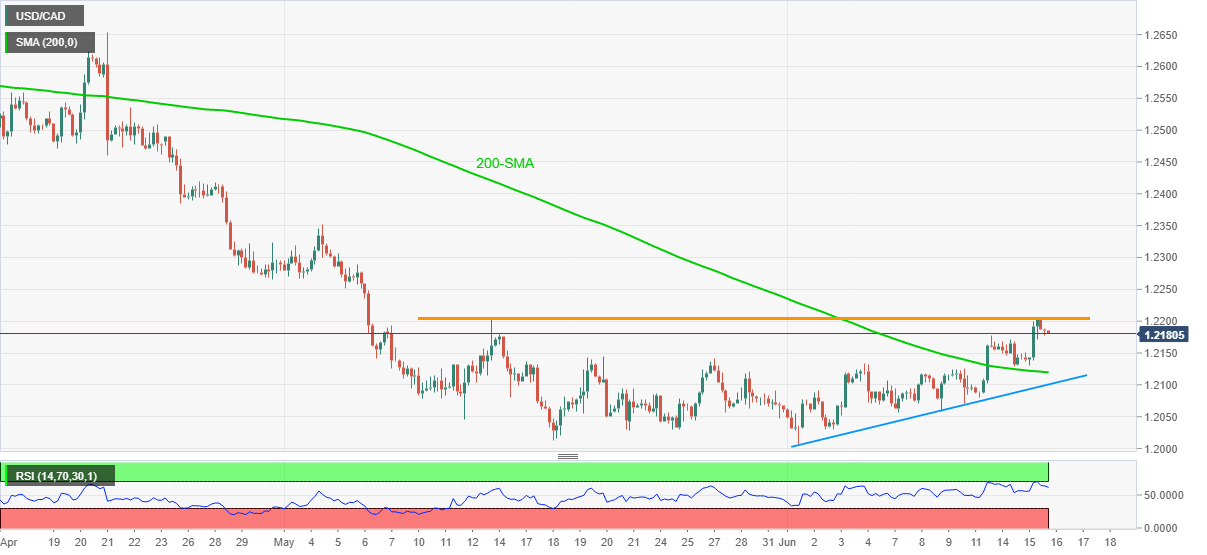
USD/CAD retreats to 1.2180 during Wednesday’s Asian session, following a run-up to weekly top the previous day. In doing so, the Loonie pair steps back from the confirmation point of a bullish chart formation, rounding bottom, amid firmer RSI.
Other than the chart pattern and RSI, the pair’s successful break above 200-SMA and an ascending support line from June 01 also keep buyers hopeful.
However, a clear upside break of 1.2205 becomes necessary for the pair to aim for the theoretical target near the 1.2400 threshold.
During the anticipated run-up, late April lows surrounding 1.2265-70 and the previous month’s high close to 1.2350-55 can offer intermediate halts.
Alternatively, the 200-SMA level of 1.2119 and the stated support line near 1.2100 could keep short-term USD/CAD sellers at bay.
Though, a sustained trading below 1.2100 may not refrain from challenging the 1.2000 psychological magnet.
USD/CAD four-hour chart
Trend: Further upside expected
