- USD/CAD struggles for a clear direction while keeping the 1.3153-1.3197 range.
- Sustained trading beyond 200-HMA favors the bulls.
- The key Fibonacci retracement levels add barriers to sellers’ entry.
USD/CAD takes rounds to 1.3175 during the early Asian session on Tuesday. In doing so, the loonie pair stays within a four-day-old symmetrical triangle.
While MACD fails to provide any clear signal, the pairs’ ability to remain beyond 200-HMA favors the bulls.
However, a clear break of the triangle’s resistance line, at 1.3188 now, will challenge Friday’s top near 1.3207 ahead of highlighting 1.3230 and the monthly top near 1.3260 for the bulls.
Alternatively, the pair’s downside break of the said triangle’s support, currently around 1.3165, will need to slip beneath the 200-HMA level of 1.3143 to convince the sellers.
Following that, 50% and 61.8% Fibonacci retracement levels of the pair’s early-month rise, respectively around 1.3130 and 1.3095, can probe the quote’s further downside.
USD/CAD hourly chart
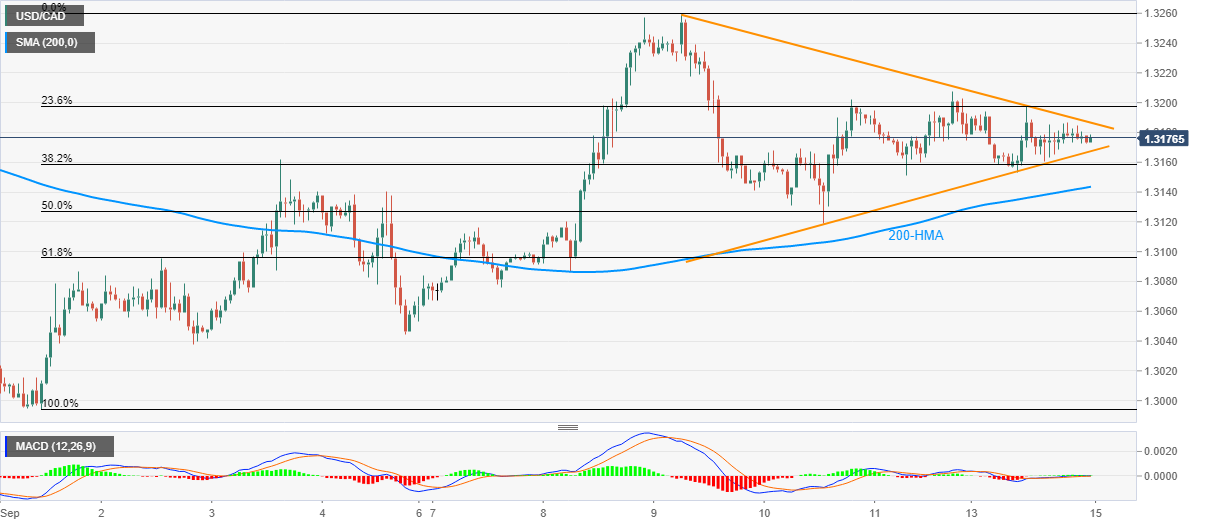
Trend: Sideways
