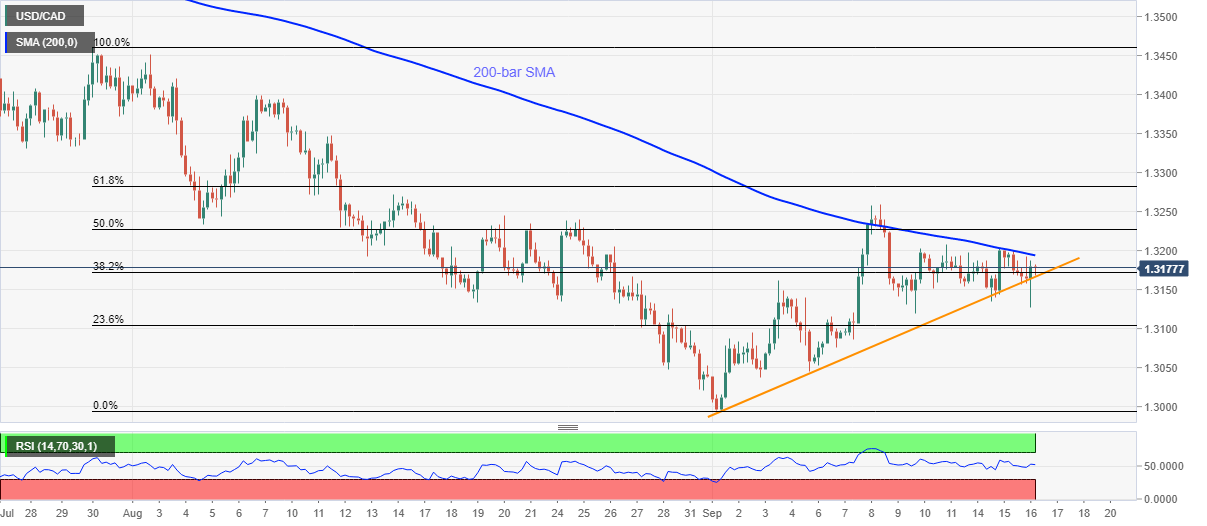
- USD/CAD remains chopped between 200-bar SMA and the monthly support line.
- Normal RSI conditions suggest continuation of the sideways moves.
- Sellers can aim for the sub-1.3100 area on the trend line break, key Fibonacci retracements may lure bulls above SMA.
USD/CAD fades bounce off intraday low of 1.3169 around 1.3176 during the pre-Tokyo open trading on Thursday. In doing so, the quote stays inside the key technical indicators, namely 200-bar SMA and an ascending trend line from September 01, amid the normal RSI conditions.
While the traders are funneling down the breakout points, odds of recovery from the multi-day lows marked during the early-month become high.
As a result, buyers will look for a clear break above the 200-bar SMA level of 1.3193 to aim 50% and 61.8% Fibonacci retracement of USD/CAD fall from July 30 to September 01, respectively around 1.3230 and 1.3280.
On the contrary, a downside break of the mentioned support line, at 1.3166 now, will break the 1.3100 threshold to revisit the September 04 low around 1.3045. Though, the monthly bottom close to 1.2995 may question the bears afterward.
All in all, USD/CAD is gradually inching closer to the breakout points and is worth watching with an upside bias.
USD/CAD four-hour chart
Trend: Sideways
