- USD/CAD seesaws near multi-week-old horizontal support, which in turn holds the gate for medium-term rising support-line.
- 50% Fibonacci retracement, 50-day EMA offers immediate resistances during the pullback.
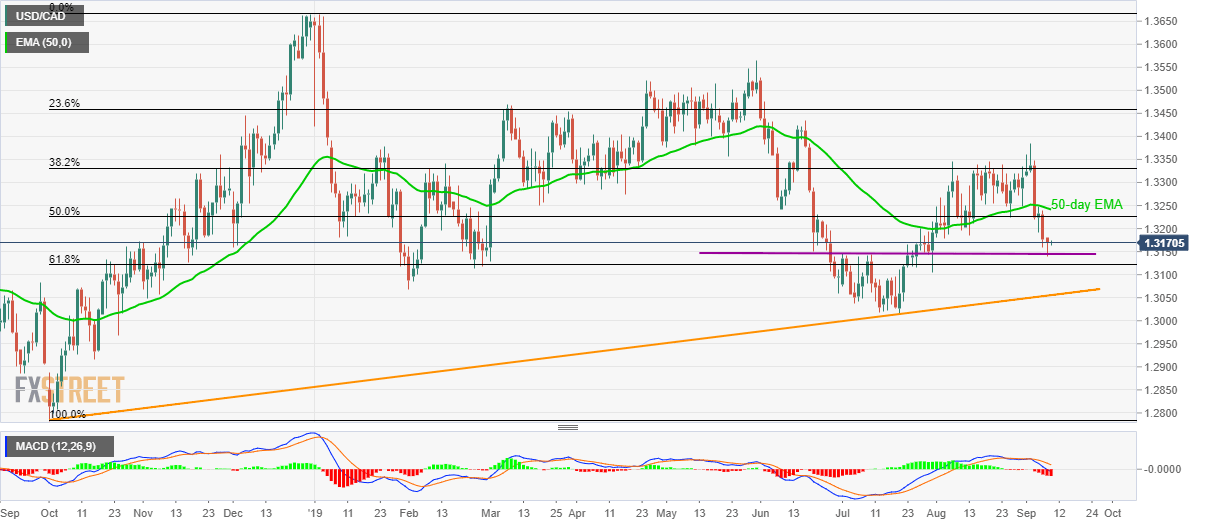
Despite successfully trading below 50% Fibonacci retracement of October – December upside and 50-day exponential moving average (EMA), USD/CAD is left to break near-term key support as it makes the rounds to 1.3175 during early Tuesday.
The pair needs to slip below 1.3150/45 horizontal area including multiple high/lows marked since late-June in order to extend its downward trajectory towards 11-month-old rising trend-line, at 1.3055 now.
Moreover, pair’s extended declines below 1.3055 might not hesitate to challenge the yearly bottom surrounding 1.3015 while aiming for mid-October 2018 low near 1.2915.
During its pullback, 50% Fibonacci retracement of 1.3226 and 50-day EMA level of 1.3240 could entertain counter-trend traders.
However, 1.3300, 38.2% Fibonacci retracement level of 1.3330 and monthly top close to 1.3385 will please buyers past-1.3240.
USD/CAD daily chart
Trend: pullback expected
