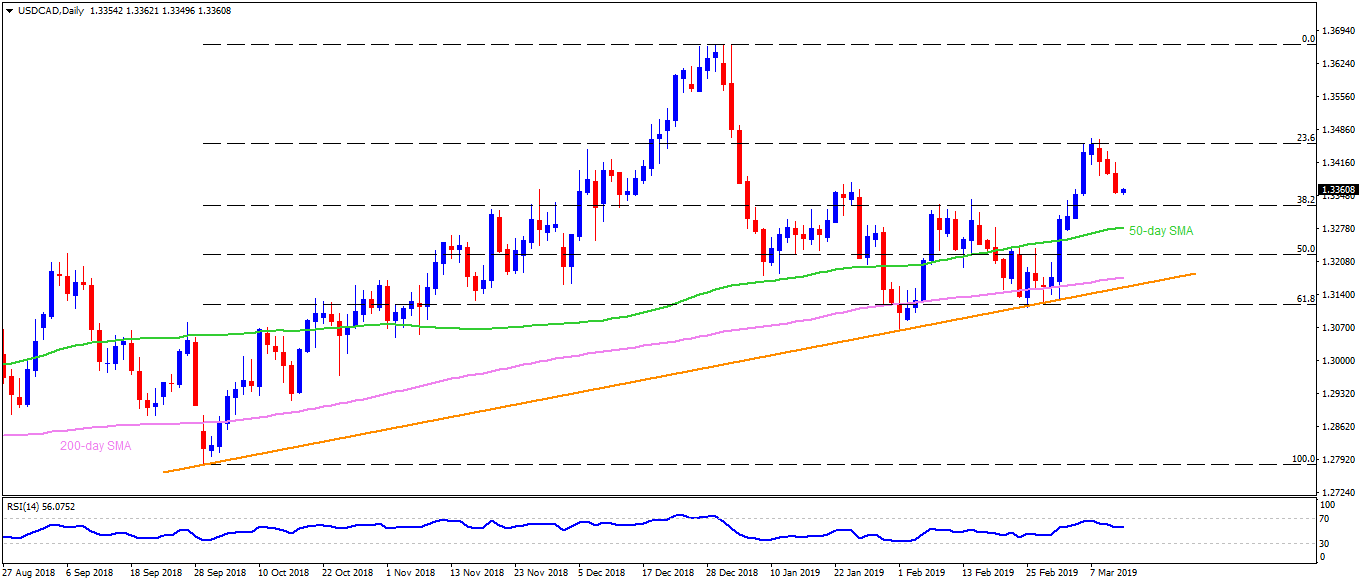
USD/CAD daily chart
- USD/CAD is taking bids around 1.3360 during early Wednesday.
- The quote took a U-turn from 23.6% Fibonacci retracement of October – December upside and is likely declining towards 38.2% Fibonacci level near 1.3325.
- Though, near oversold levels of 14-day relative strength index (RSI) and repeated reversals from 1.3330-25 signal brighter chances of the pair’s another pullback.
- In a case prices decline below 1.3325, 50-day simple moving average (SMA) near 1.3280, followed by 200-day SMA level of 1.3170, can offer intermediate halts ahead of drawing sellers’ attention to 1.3150 support-line.
- On the upside, 1.3390 and 1.3460-70 area, comprising 23.6% Fibonacci, could confine the pair’s near-term advances.
- Should pair rise past-1.3470, 1.3570 and 1.3670 might lure bulls.
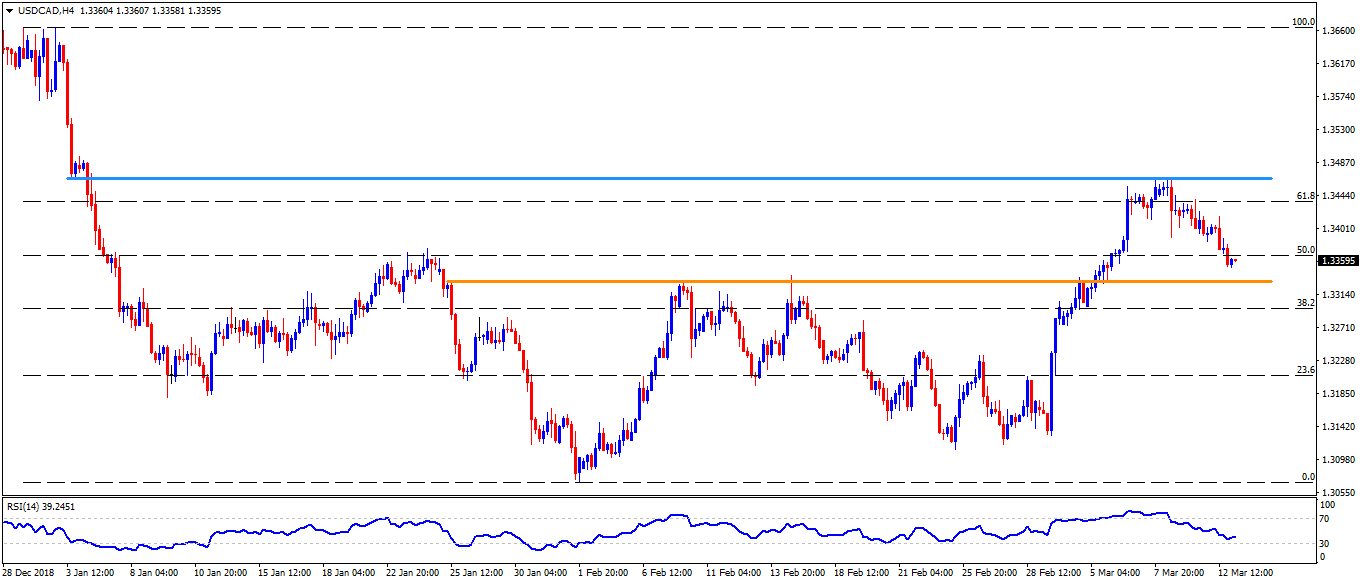
USD/CAD 4-Hour chart
- 1.3240 can act as a buffer between the 1.3330-25 support-zone and 1.3170 level.
- Also, the break of 1.3500 can validate the pair’s rise to 1.3570 after 1.3470.
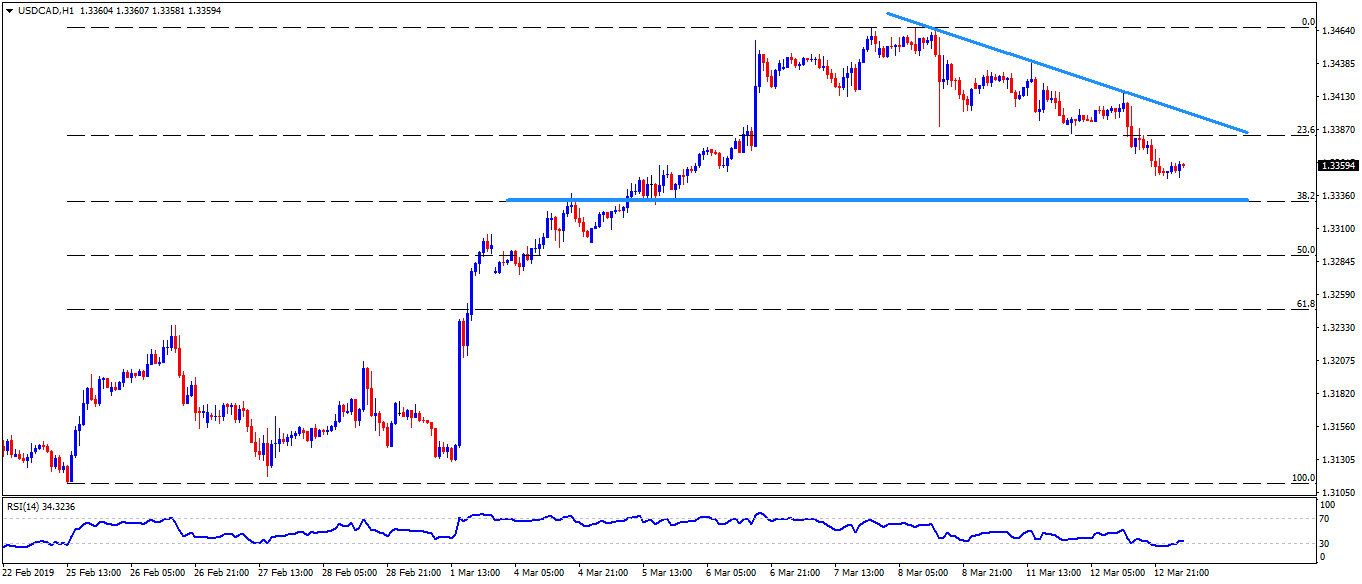
USD/CAD hourly chart
- 1.3400 can magnify the distance between 1.3390 and 1.3470.
- The 1.3200 round-figure may offer intermediate halt ahead of highlighting 1.3170 support-level.