- USD/CAD maintains break of 50-day SMA, signals gradual declines to short-term rising trend-line.
- Monthly resistance-line, 200-day SMA seem nearby key upside barriers.
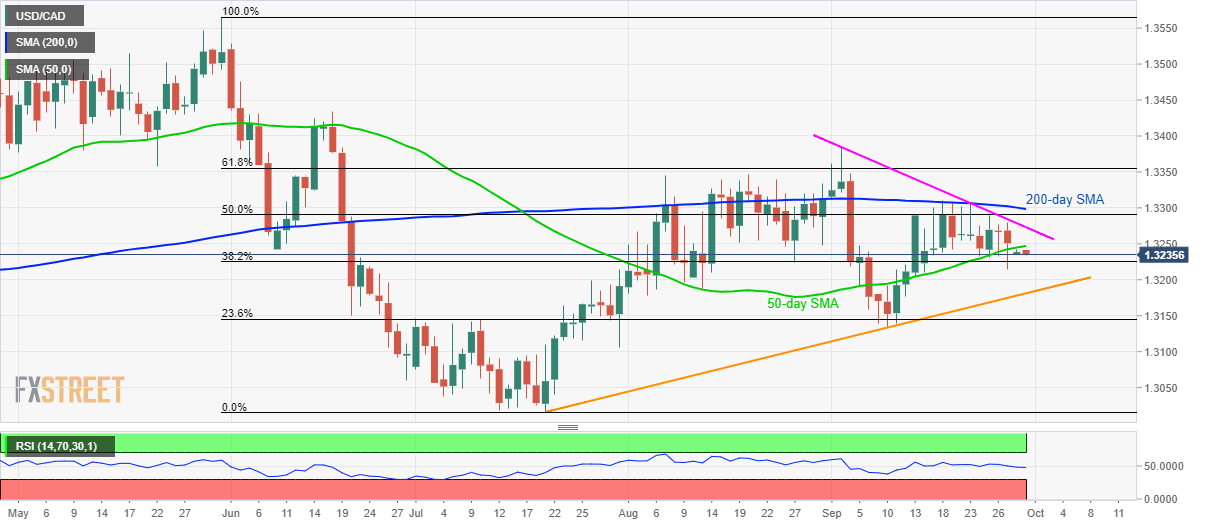
With its sustained trading below the 50-day simple moving average (SMA), USD/CAD declines to 1.3235 during early Asian session on Monday.
Pair’s refrain from clearing the key moving averages, namely the 50-day and the 200-day SMA, portrays weakness in underlying momentum, which in turn signals gradual declines to an upward sloping trend-line since July 19, at 1.3180 now.
Though, 23.6% Fibonacci retracement of May-July south-run, at 1.3145, could restrict pair’s declines past-1.3180, if not then 1.3090 and yearly bottom near to 1.3015 could please bears.
Meanwhile, the pair’s break of 50-day SMA level of 1.3247 can trigger fresh recovery targeting a monthly resistance-line, close to 1.3275.
It should also be noted that pair’s rise past-1.3275 needs to provide a daily closing beyond 200-day SMA level of 1.3300 in order to motivate bulls to target monthly top nearing 1.3385.
USD/CAD daily chart
Trend: bearish
