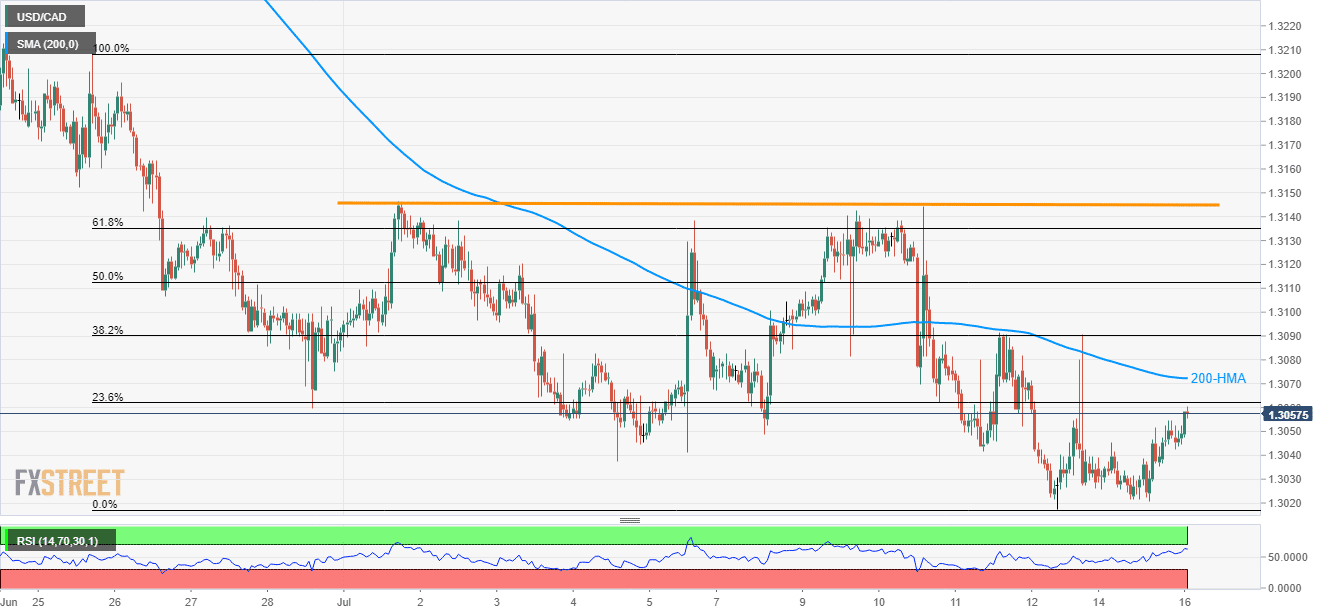
- RSI close to the overbought territory near key resistances indicates a reversal of latest short-covering moves by the USD/CAD pair.
- 1.3000 continues to grab sellers’ attention.
Despite its gradual recoveries from 1.3020, the USD/CAD pair still lags key resistances as it takes the rounds to 1.3057 during early Tuesday.
Not only 23.6% Fibonacci retracement of late-June high to last week’s low, at 1.3062, but 200-hour moving average (HMA) at 1.3072 also limits the pair’s immediate upside.
Should buyers refrain from respecting 1.3075 resistance, 38.2% Fibonacci retracement near 1.3090 holds the gate for the pair’s run-up towards 1.3045/50 horizontal-area comprising current month high.
Other than strong resistances, overbought levels of 14-bar relative strength index (RSI) also highlight the comeback to 1.3035 and 1.3020 whereas 1.3000 round-figure can lure sellers after.
If bears dominate momentum below 1.3000, mid-October 2018 low surrounding 1.2920 could mark their presence on the chart.
USD/CAD hourly chart
Trend: Pullback expected

