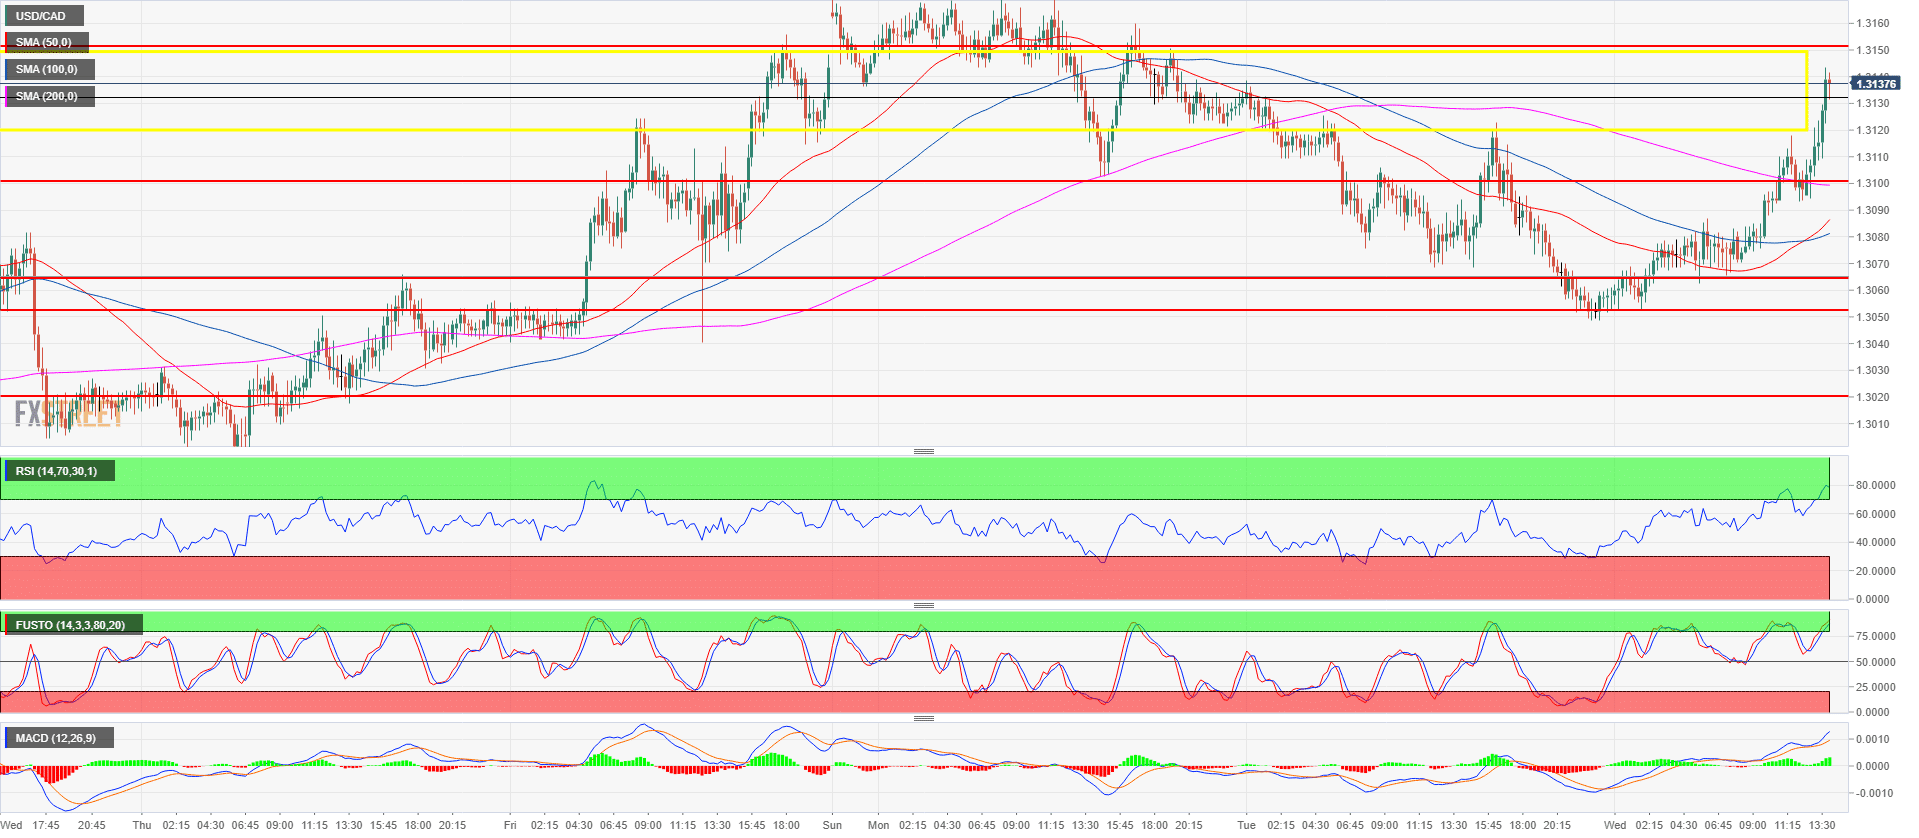
- USD/CAD is trading up into a key resistance area at 1.3120-1.3155.
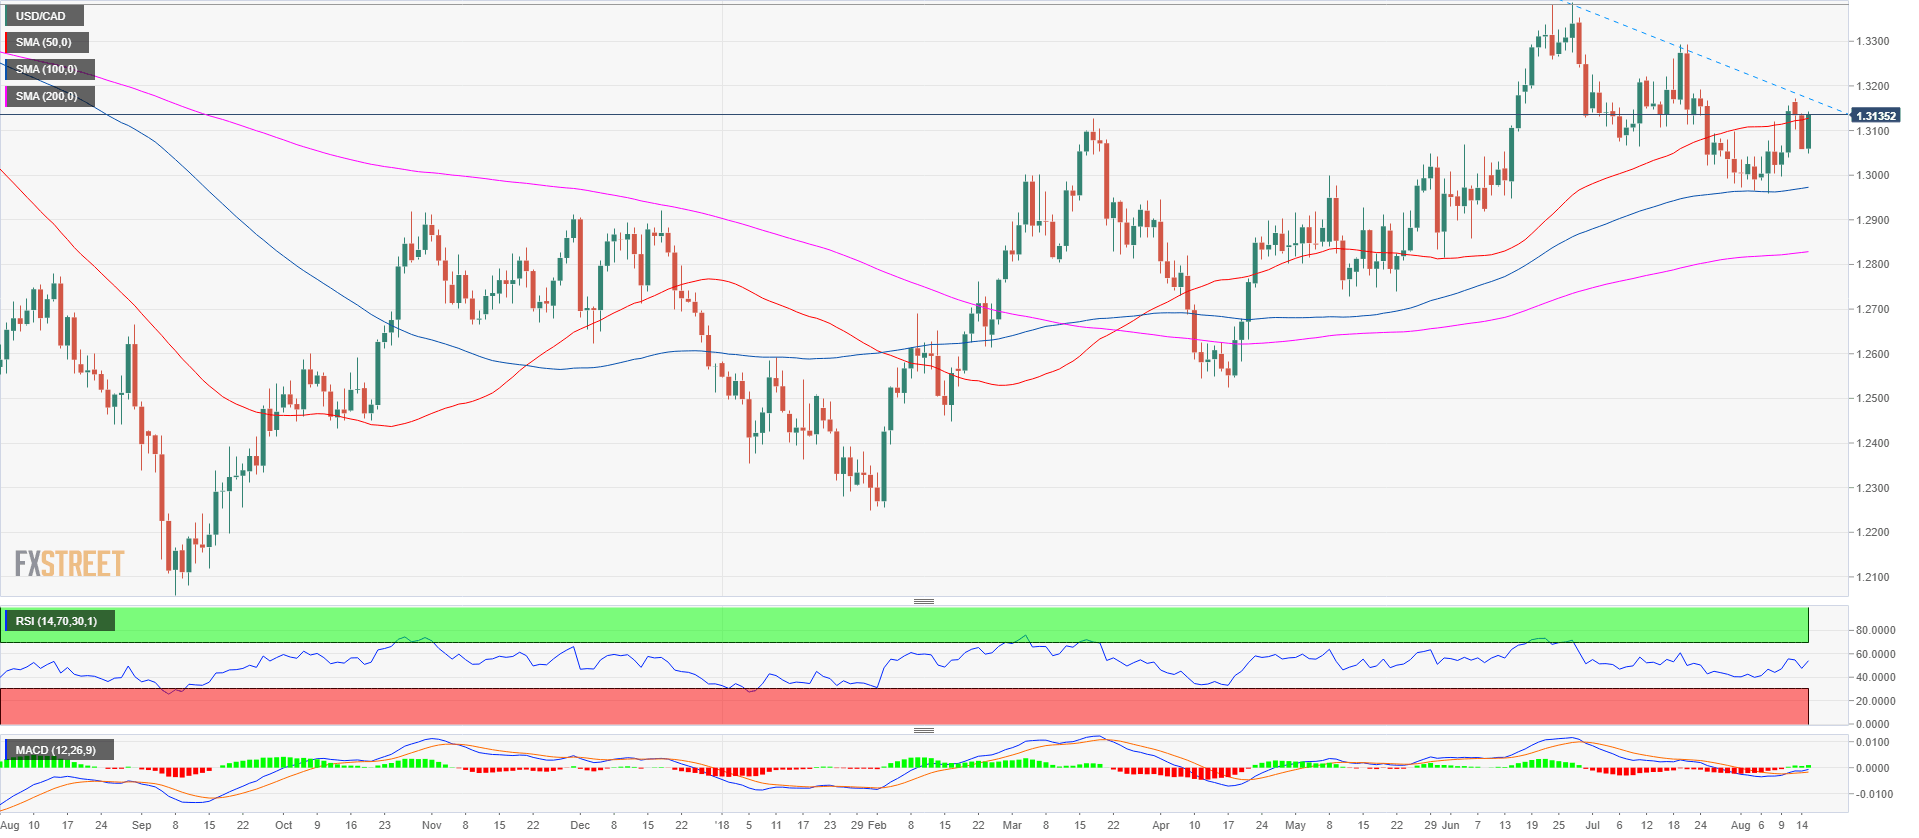
- USD/CAD bulls objective is to breakout above this zone and the daily bearish trendline in order to resume the main bull trend.
- Targets to the upside are seen near 1.3172, 1.3200 and 1.3271 June 29 high. Supports are located near 1.3100 figure, 1.3053-1.3066 area and 1.3022 July 25 low.
USD/CAD 15-minute chart
USD/CAD daily chart
Spot rate: 1.3137
Relative change: 0.60%
High: 1.3143
Low: 1.3048
Trend: Bullish
Short-term Trend: Bearish below 1.3120-1.3155 area
Resistance 1: 1.3120-1.3155 area, supply/demand level and June 18 low
Resistance 2: 1.3172 August 13 swing high
Resistance 3: 1.3200 figure
Resistance 4: 1.3271 June 29 high
Resistance 5: 1.3350 figure
Resistance 6: 1.3388, 2018 high
Resistance 7: 1.3543 June 9, 2017 swing high
Support 1: 1.3100 figure
Support 2: 1.3053-1.3066 area, June 5 swing high and July 9 low
Support 3: 1.3022 July 25 low
Support 4: 1.3000 figure
Support 5: 1.2974 August 1 swing low
Support 6: 1.2900 figure
Support 7: 1.2855 June 6 low
