- Failure to hold a four-month-old trend-line breakout pulls USD/CAD back.
- Sellers can recall 200-day SMA on the downside break of resistance-turned-support.
USD/CAD struggles to extend its latest upward trajectory while taking rounds to the near-term falling trend-line as it trades close to 1.3330 amid the initial Asian session on Thursday.
Sellers await a clear break below resistance-turned-support-line, at 1.3320, in order to target 1.3295/90 area including 200-day simple moving average (SMA) and 50% Fibonacci retracement of May-July downpour.
Should prices decline below 1.3290, 1.3200 and September month low nearing 1.3130 could become bears’ favorites.
On the contrary, 61.8% Fibonacci retracement level of 1.3355 and another falling trend-line since June 18, at 1.3365, could offer additional challenges to the buyers ahead of pushing them towards September month high of 1.3384 and late-June top surrounding 1.3434.
USD/CAD daily chart
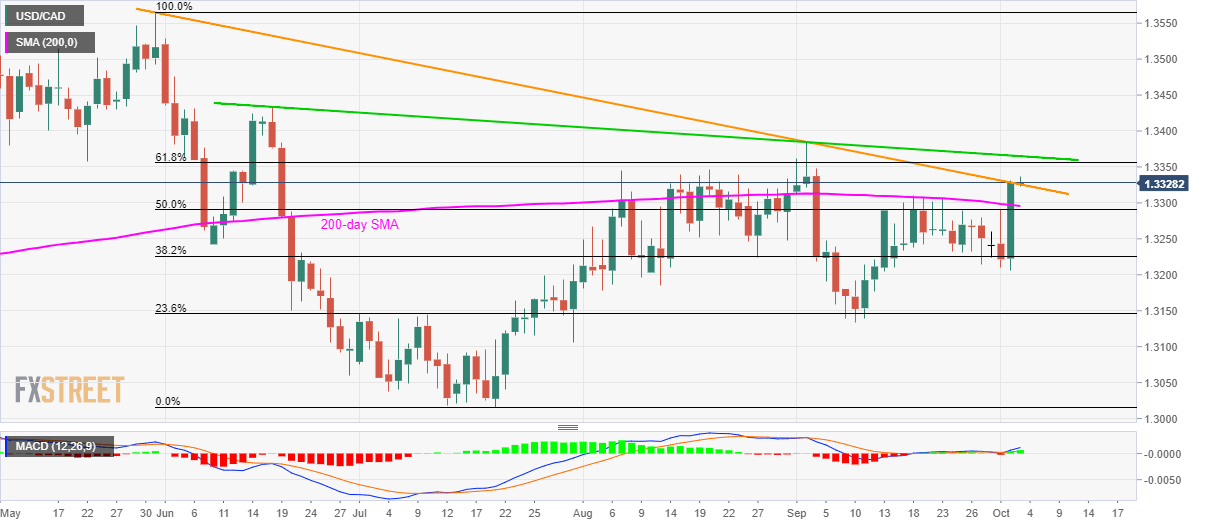
Trend: pullback expected
