- USD/CAD stays firm beyond the previous resistance confluence (now key support).
- Price positive RSI conditions indicate further run-up.
- 200-day SMA offers additional support.
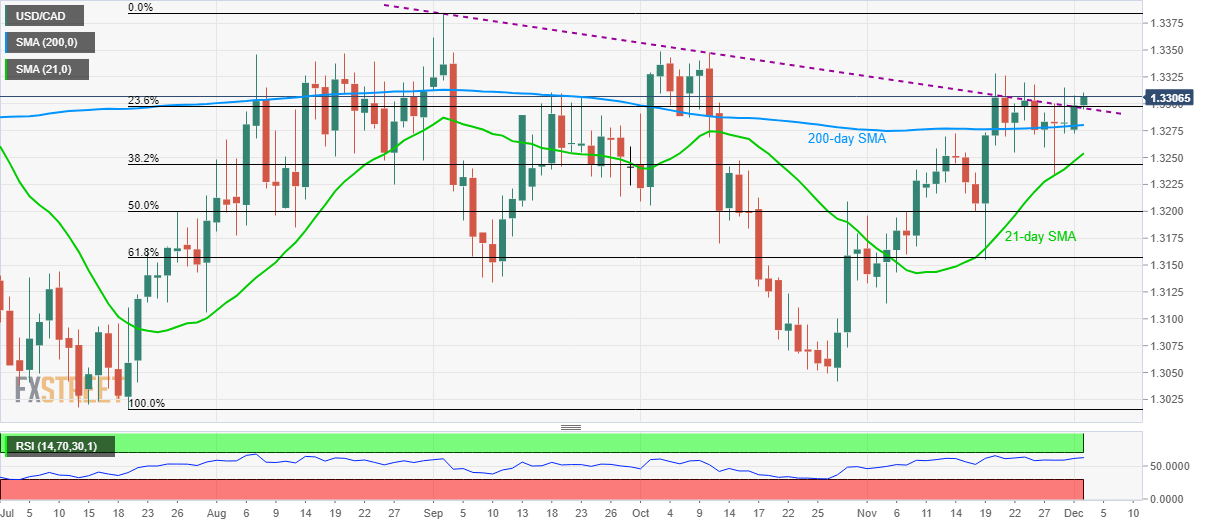
USD/CAD takes the bids to 1.3305 during early Tuesday. In doing so, the quote remains beyond a three-month-old falling trend line and 23.6% Fibonacci retracement of July-September upside.
Prices are now heading towards the previous month top close to 1.3330 whereas highs marked in October and September months, around 1.3350 and 1.3385 respectively, could please buyers next.
It’s worth mentioning that the 14-day Relative Strength Index (RSI) stays firmer and supports the on-going price momentum to the north.
Meanwhile, pair’s declines below 1.3300/3295 support confluence shifts focus to 200-day Simple Moving Average (SMA) level of 1.3280 while 21-day SMA near 1.3255 might return to charts then after.
USD/CAD daily chart
Trend: Bullish
